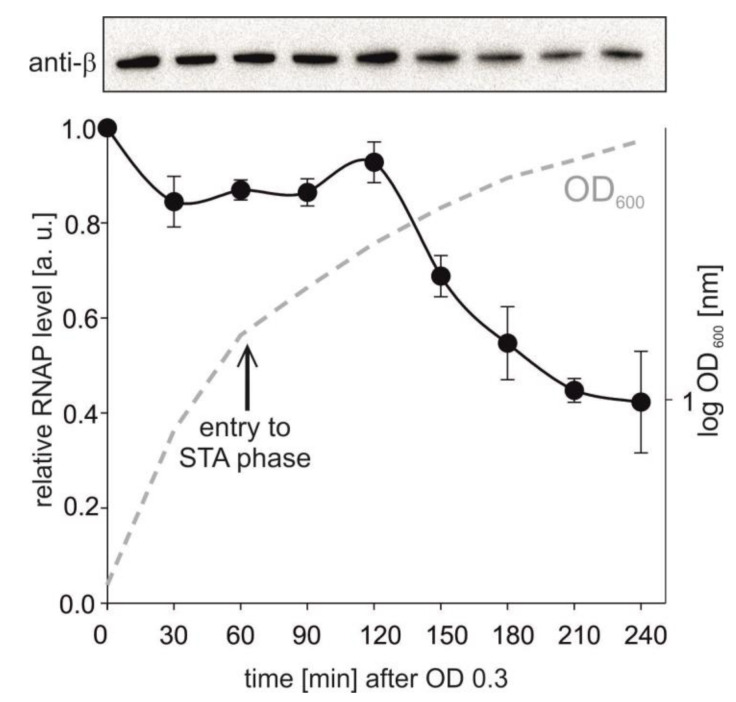
Figure 5.
RNAP levels during bacterial growth. Amounts of RNAP were detected by Western blotting from 5 μg of total protein per lane. Representative primary data are shown above the graph. The RNAP level from time point 1 was set as a 1. STA—stationary phase (indicated with the arrow). The experiment was conducted in two independents replicas. The points are averages, the error bars show the range. The dashed line shows a representative bacterial growth.

