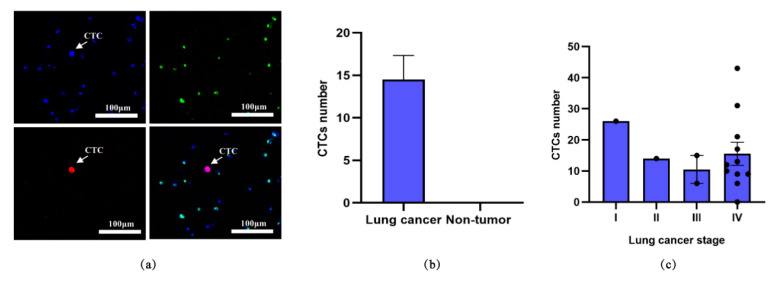
Figure 3.
Analysis of captured CTCs from blood samples of patients. (a) Representative fluorescent staining images of CTC detected in a blood sample of a lung cancer patient. The blue color referred to nuclear staining (DAPI), the green color referred to CD45, and the red color demonstrated CK expression. Magnification, ×200. (b) The average number of CTCs in lung cancer patients (n = 16) and non-tumor patients (n = 4). (c) The average number of CTCs in lung cancer patients of different stages (Stage I, n = 1; Stage II, n = 1; Stage III, n = 2; Stage IV, n = 11).

