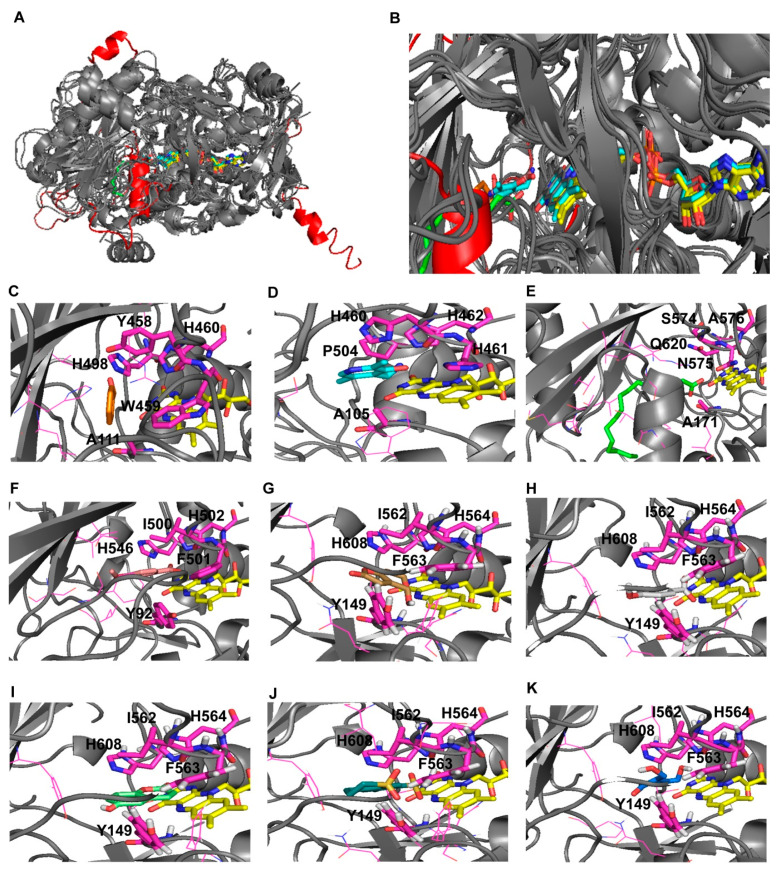
Figure 4.
Comparative analysis for identifying the best grid box for Virtual Screening analysis. P. expansum GMC comparative model is reported in grey cartoon. FAD is reported in yellow sticks. Panel A: superimposition of P. expansum GMC oxidoreductase 3D model and crystallized homologous proteins substrates, inhibitors and FAD cofactor. Panel B: exploded view of the FAD binding region. Panel C: benzaldehyde (HBX) reported in orange sticks representation crystallized within “6lqy.pdb”. Panel D: 4-(aminomethyl)-5-(hydroxymethyl)-2-methylpyridin-3-ol (PMX) reported in cyan sticks representation, crystallized within “4ha6.pdb”. panel E palmitic acid (PLM) reported in green sticks representation, crystallized within “5ncc.pdb”. Panel F: p-anisic acid (ANN) reported in light pink sticks representation, crystallized within “5oc1.pdb”. patulin reported in light brown sticks representation (panel G); p-anisic acid reported in light gray sticks representation (panel H); 6-hydroxycoumarin reported in light green sticks representation (panel I); meticrane reported in green cyan sticks representation (panel J); (E)-ascladiol reported in blue sticks representation (panel K) within the P. expansum GMC oxidoreductase as obtained from docking analyses. Residues numbering of “6lqy.pdb”, shown in panel C, and residues numbering of the “6lqy” fasta sequence, shown in Figure 2, differs of 6 units (i.e., A111; Y458, W459, H460 and H498 reported in panel D corresponds to A117; Y464, W465, H466 and H504 reported in Figure 2, in blocks 3, 8 and 10, respectively). Residues numbering of “4ha6.pdb”, shown in panel D, and residues numbering of the “4ha6” fasta sequence, shown in Figure 2, differs of 16 units (i.e., A105; H460, H461, H462 and P504 reported in panel D corresponds to A89; H444, H445, H446 and P488 reported in Figure 2, in blocks 3, 8 and 10, respectively). Residues numbering of “5ncc.pdb” chain A, shown in panel E, and residues numbering of the “5ncc” fasta sequence, shown in Figure 2, differs of 60 units (i.e., A171; N575 and Q620 reported in panel E corresponds to A111; N515 and Q560 reported in Figure 2, in blocks 3, 8 and 10, respectively). Residues numbering of “5oc1.pdb”, shown in panel F, and residues numbering of the “5oc1” fasta sequence, shown in Figure 2, differs of 1 unit (i.e., Y92; I500, F501, H502 and H546 reported in panel D corresponds to Y91; I499, F500, H501 and H545 reported in Figure 2, in blocks 3, 8 and 10, respectively).

