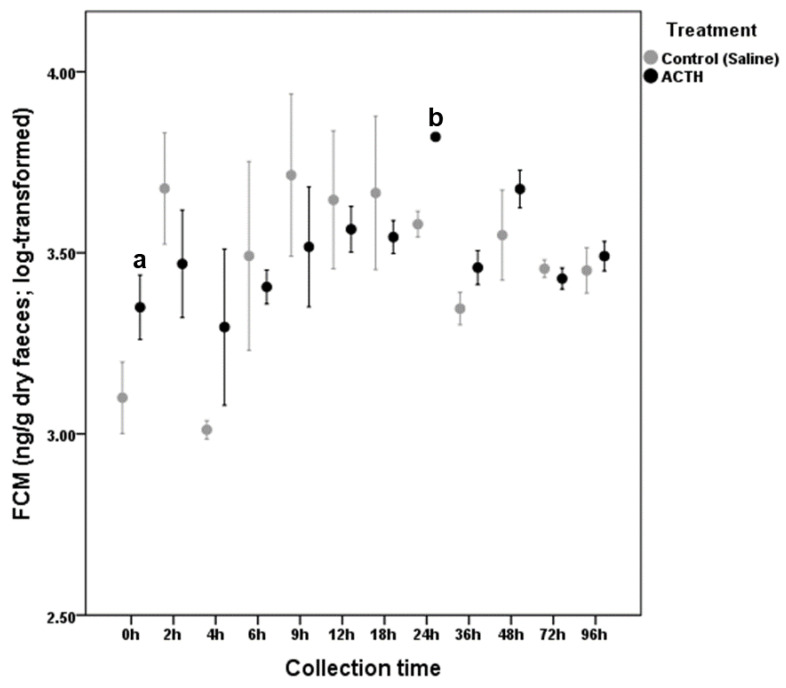
Figure 3.
Fecal Corticosterone Metabolite variation (mean ± SE) in G. pyramidum (only males) after ACTH (adrenocorticotropic hormone) (n = 3) or saline solution (n = 3) injection. Significant differences between basal (right before the injection) and peak FCM (fecal corticosterone metabolites) values are indicated with different small letters.

