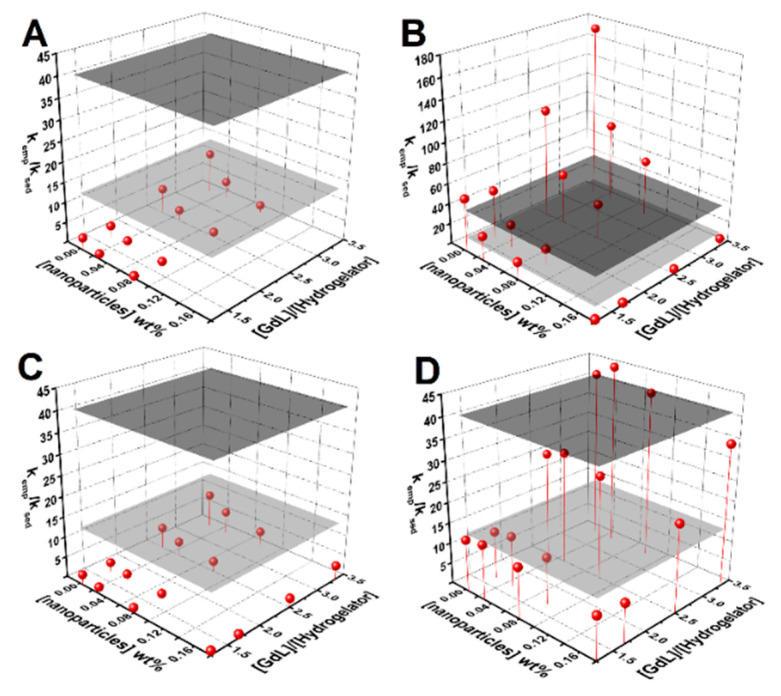
Figure 3.
Surface plots of kemp/ksed dependence on nanoparticle concentration and the GdL-to-hydrogelator concentration ratio for: (A) bare nanoparticles, (B) the citrate-stabilized nanoparticles aggregation rate, (C) the sedimentation rate, and (D) lipid-coated nanoparticles. The gray planes define the estimated kemp/ksed required to guarantee that when the gel is about 10% of gelation completion, 90% of the nanoparticles remains in suspension (ν = 1, a = 0.5, dark gray plane; ν = 0.5, a = 0.5, gray plane).

