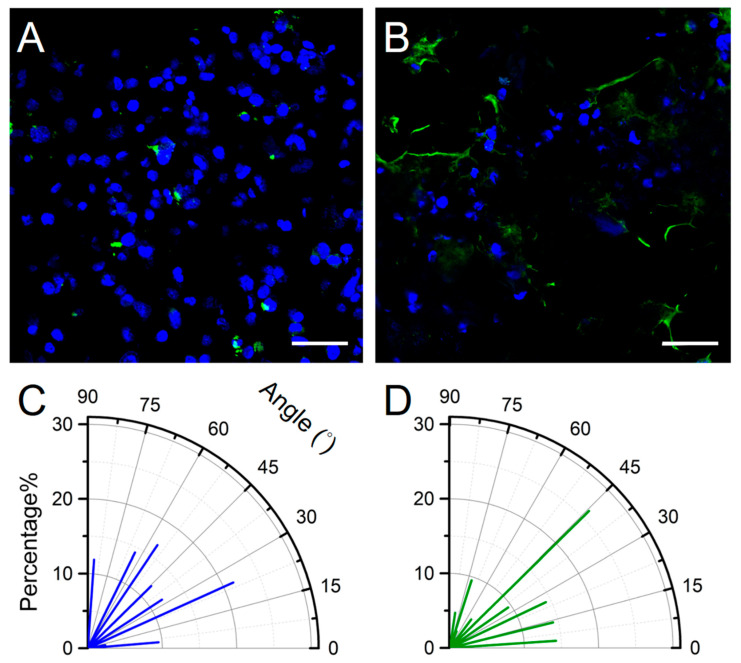
Figure 8.
Cellular immunofluorescence staining and angle calculation. (A) no ZO-1 expression is visible in cells not exposed to shear stress, and (B) ZO-1 expression (green) is visible in cells under shear stress as documented using a confocal laser scanning microscope (DAPI: blue). Cell growth angles for cells under (C) no shear stress and (D) 5 dyne/cm2 shear stress for one day (n = 42).

