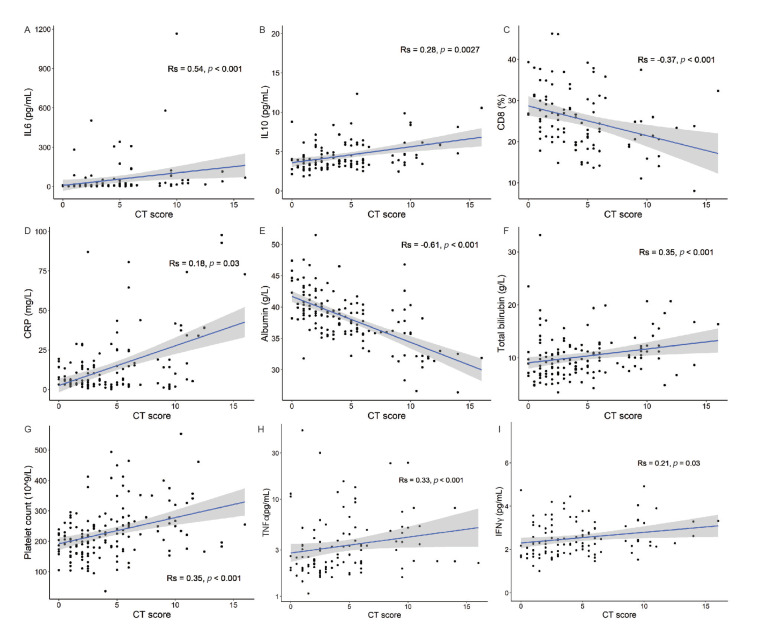
Figure 4.
The severity of lung abnormalities is associated with specific immune and clinical biomarkers. Scatterplots depicting associations between CT scores and various blood-based biomarkers. Spearman’s correlation coefficients were calculated between CT scores and (A) IL-6, (B) IL-10, (C) CD8+ T cells, (D) CRP, (E) albumin, (F) total bilirubin, (G) platelets, (H) TNF-α, and (I) IFN-γ, as indicated. Shaded areas indicate 95% confidence intervals.

