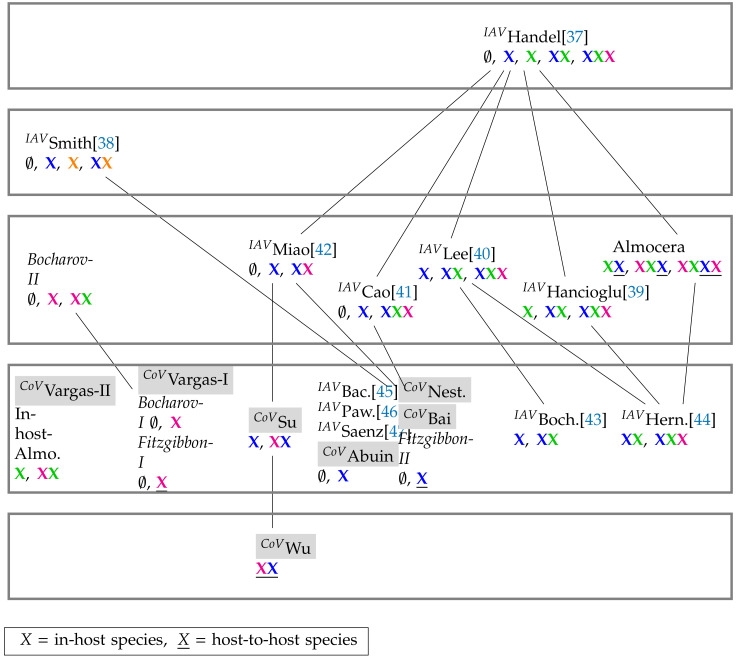
Figure 16.
Merged Hasse-diagram of hierarchy of SARS-CoV-2 (tagged with CoV()), IAV models (tagged with ), and general virus models. They are positioned at five different levels according to the size of their signatures. The higher the level of a model, the bigger is the number of components of its signature and thus the diversity of its potential dynamical behavior. By clicking on the model names you are directed to the respective part of this work where the models are analyzed [37,38,39,40,41,42,43,44,45,46,47]. PDE model names are written in italic. Note, that contrary to many Influenza-A infection models (third level and above) all SARS-CoV-2 infection models are on the second level (counted from bottom to top) and thus have a maximum number of two different species in their signature. This means that they are less complex in terms of their organizations than most of the Influenza-A infection models. Note that the Smith Influenza-A model is the only one that considers co-infection by bacteria X. For more information about the COT analysis of the Influenza-A infection models see [19].

