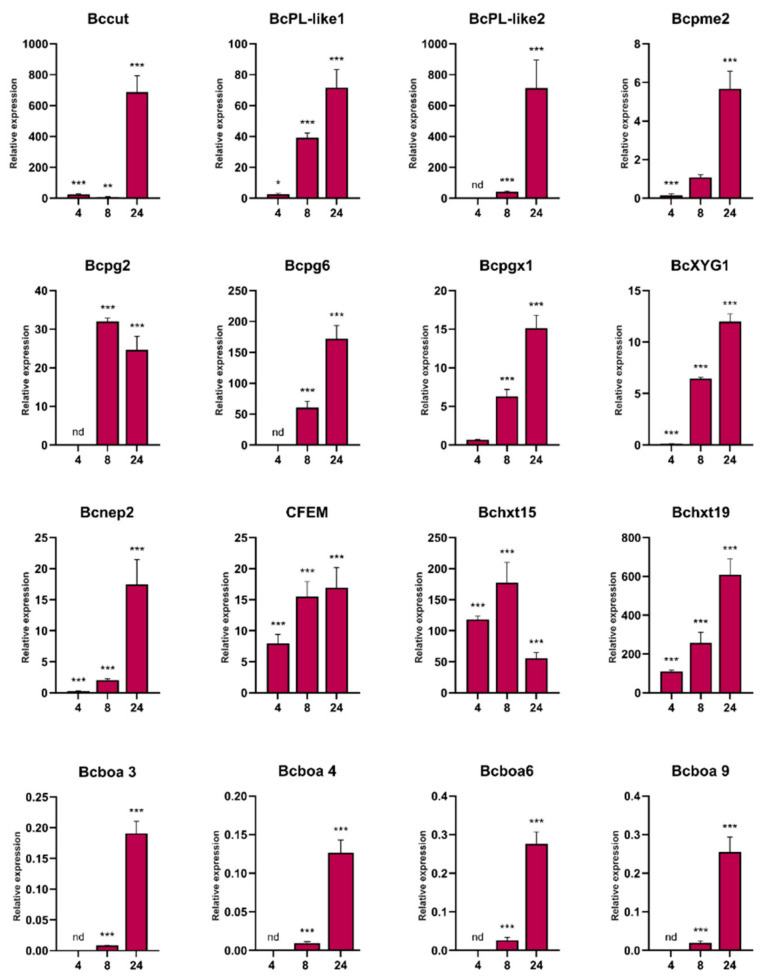
Figure 3.
Validation of B. cinerea differentially expressed genes during P. patens infection by quantity reverse transcription RT-qPCR at 4, 8 and 24 hpi. The expression levels of B. cinerea genes infecting P. patens at the indicated time points are relative to the level of expression of B. cinerea grown in PDA. Genes are represented by the corresponding abbreviation as indicated in Table S1. BctubB was used as the reference gene. Results are reported as means ± standard deviation (SD) of three samples for each treatment. Asterisks indicate a statistically significant difference between B. cinerea grown in P. patens and in PDA (Students t-test, * p < 0.5, ** p <0.01; *** p < 0.005). Abbreviation: nd: no data.

