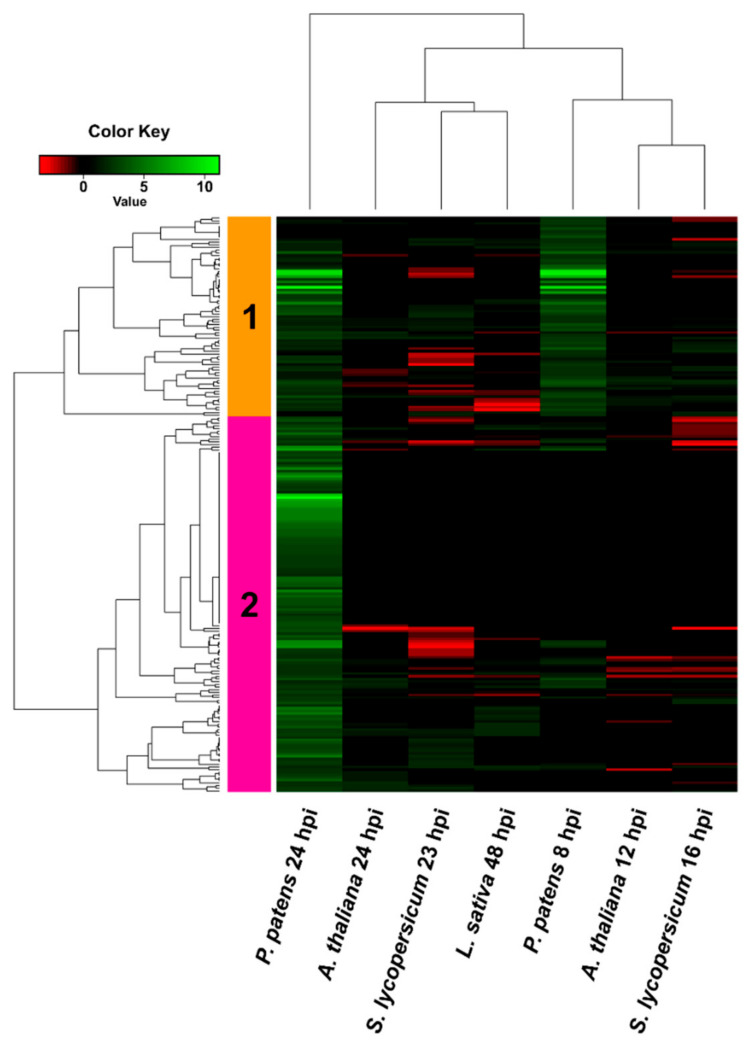
Figure 7.
Hierarchical clustering (heat map) showing B. cinerea genes only upregulated in P. patens. DEGs correspond to the 216 genes that were only upregulated when growing in P. patens. Selected DEGs had log2 FC ≥ 2, FDR ≤ 0.05, and were expressed differentially in at least one time point for each plant species. For samples where no significant difference with control was observed (FDR > 0.05) or no data was available, the log2 FC was assigned as cero. See Table S13 for complete information.

