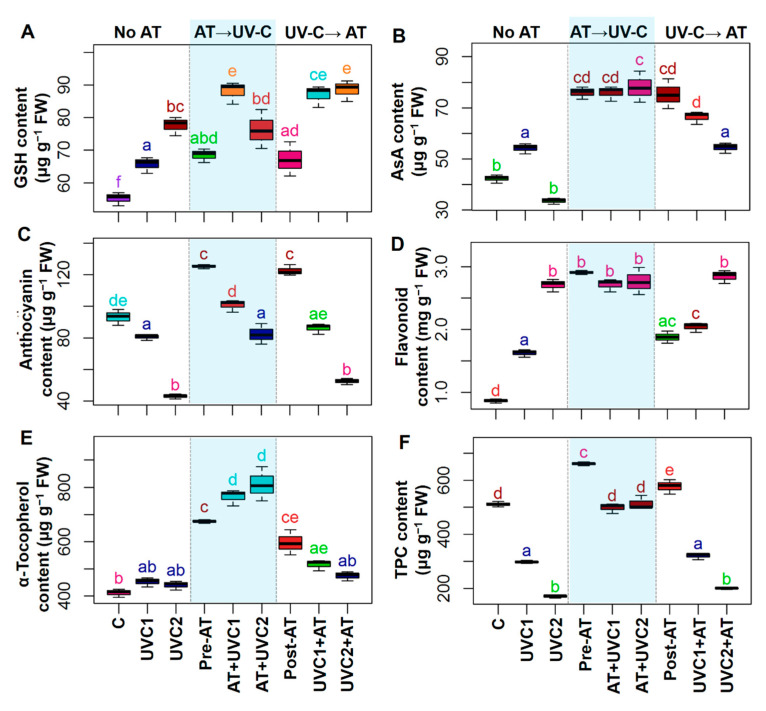
Figure 3.
Effects of pre-treatment and post-treatment of allantoin (AT) on glutathione (GSH) (A), ascorbic acid (AsA) (B), anthocyanin (C), flavonoid (D), α-tocopherol (E), and phenolic compounds (TPC) contents (F) in tomato plants grown 15 days in presence and absence of UVC stress. Each boxplot shows values of five independent replicates (n = 5). Boxplots specified with the same letter(s) are statistically non-significant at p < 0.05 based on Tukey’s test. Treatments are the same as Figure 1.

