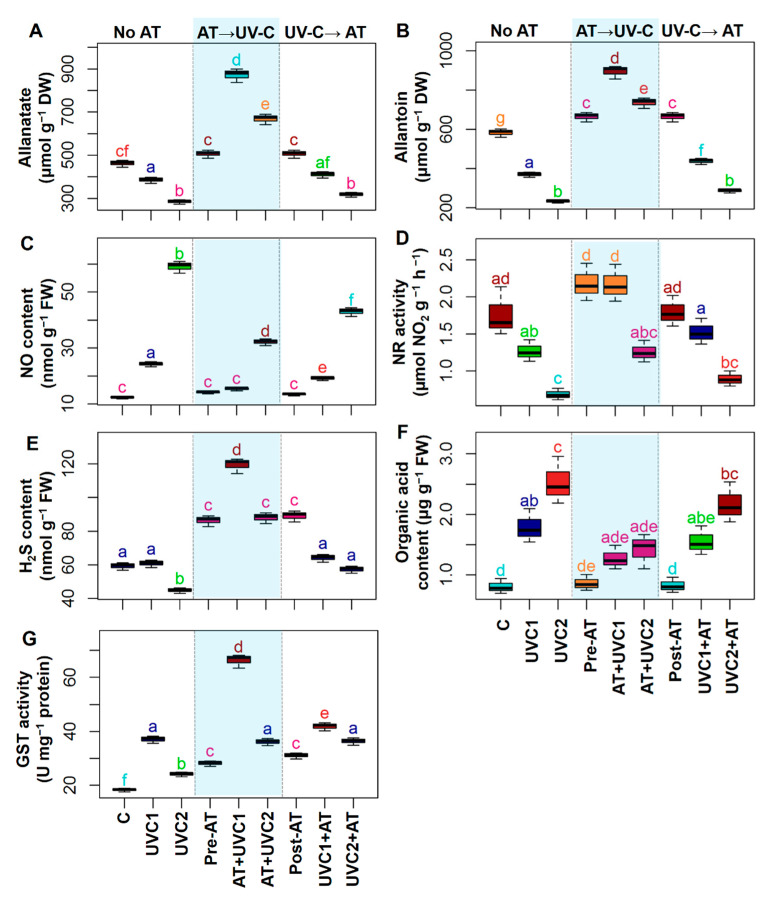
Figure 5.
Effects of pretreatment and post-treatment of allantoin (AT) on allantoate contents (A), endogenous AT content (B), nitric oxide (NO) content (C), nitrate reductase (NR) activity (D), hydrogen sulfide (H2S) content (E), organic acid content (F), and glutathione S-transferase (GST) activity (G) in tomato plants grown 15 days in presence and absence of UVC stress. Each boxplot shows values of five independent replicates (n = 5). Boxplots specified with the same letter(s) are statistically non-significant at p < 0.05 based on Tukey’s test. Treatments are the same as Figure 1.

