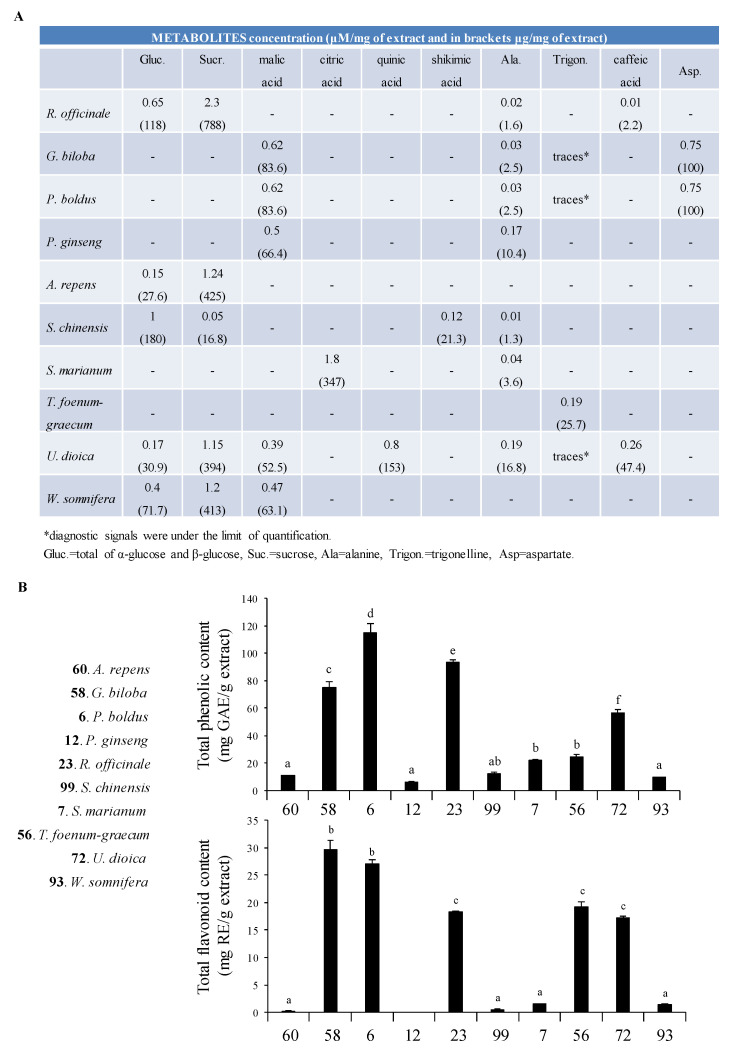
Figure 2.
(A) Reported are the main metabolites identified in the extracts by 1H NMR (nuclear magnetic resonance) profiling and quantified by comparison of metabolites diagnostic signal(s) and TMSP (trimethylsilylpropanoic acid) as internal standards. (B) Total phenolic (upper panel) and total flavonoid content (lower panel) of the most active extracts were measured. Different letters within the same assay indicate significant differences by one-way analysis of variance (ANOVA) test (p < 0.05). Results are expressed as means ± SD (standard deviation) of three independent experiments.

