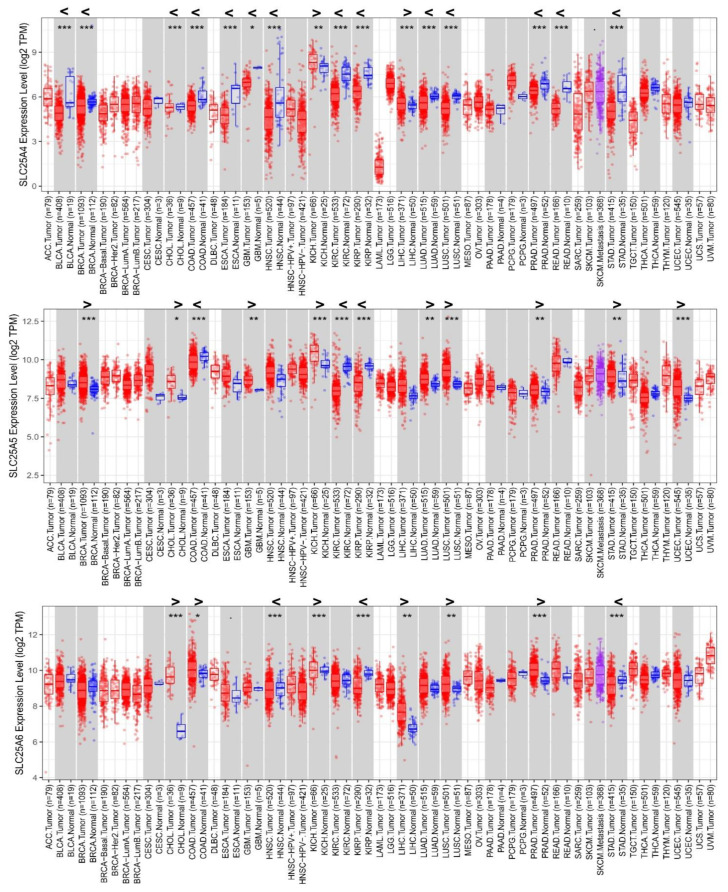
Figure 1.
SLC25A4_AAC1, SLC25A5_AAC2, SLC25A6_AAC3 expression levels in 21 “cancer vs. normal” tissue pairs available on TCGA, analyzed through Timer2. The 21 “cancer (red box plots) vs. normal (blue box plots)” tissue pairs are reported and displayed on a grey background. Cancer tissues without a normal counterpart are reported and displayed on a white background. The violet box plot indicates AAC expression levels in the metastatic SKCM tissue within the “tumor/metastasis” SKCM tissue pair. For a list of the abbreviations, please see https://gdc.cancer.gov/resources-tcga-users/tcga-code-tables/tcga-study-abbreviations. The Gene_Differential Expression (DE) module allows users to study the differential expression between tumor and adjacent normal tissues for any gene of interest across all TCGA tumors. Distributions of AAC gene expression levels are displayed using box plots. The statistical significance computed by differential analysis (edgeR) on RNA-Seq raw counts is annotated by the number of stars (*: p-value < 0.05; **: p-value < 0.01; ***: p-value < 0.001). Readers can identify upregulated (>) or downregulated (<) AAC genes in the tumors compared to normal tissues for each cancer type, as displayed in gray highlighted columns when normal data are available. The “n” values reported below the boxplots refer to the number of patients whose cancer/normal tissue sample pairs are available in the TCGA database.

