Figure 2.
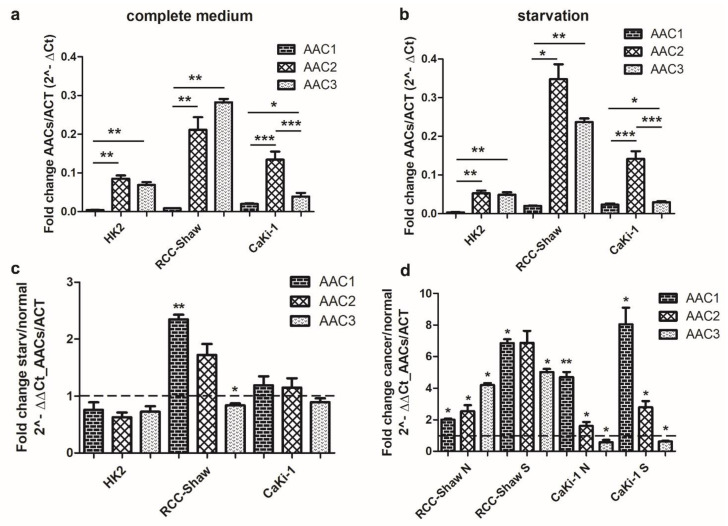
qRT-PCR of AAC1, AAC2, and AAC3 in non-cancer kidney cells (HK2) and cancer (CaKi-1 and RCC-Shaw) cells. Comparison of the AAC1, AAC2, and AAC3 gene expression levels between cells grown in complete medium (a), cells grown in serum-deprived medium (b), cells grown under starved (serum-free) conditions vs. normal (complete medium) conditions (c), and cancer cells vs. non-cancer cells are reported (d). Panel d: “N” indicates normal (complete medium) growth conditions, “S” indicates starved (serum-free) conditions. Data are presented as mean + SE of at least three independent experiments. The reported AAC expression levels were normalized to the nuclear housekeeping ACT gene. * p < 0.05; ** p < 0.01, *** p < 0.001, nonparametric Wilcoxon two-tailed test between starved and physiological conditions. “Starvation” indicates cells grown in a serum-free medium. “ACT” indicates actin.

