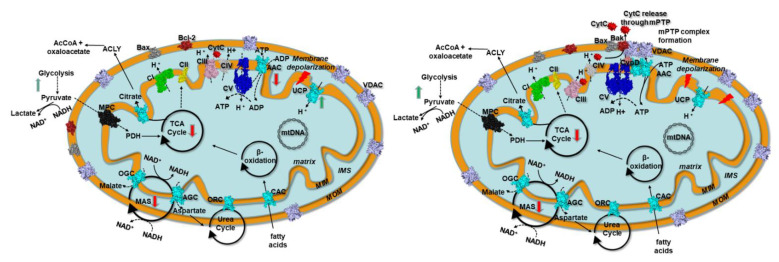
Figure 6.
Scheme of mitochondria with a set of representative proteins, pathways, and cycles in kidney cancer prior and after mPTP formation. Left panel. Kidney cancer mitochondria resistant to mitochondrial apoptosis. Right panel. Kidney cancer mitochondria after mPTP formation. Respiratory chain complexes, mitochondrial transporters, and other proteins are reported in surf representation and labeled. ATP synthase (CV) is reported in blue. Mitochondrial carriers are reported in cyan. VDAC is reported in pink. Bax and Bak/Bcl-2 are reported in dark-grey and firebrick, respectively. MPC is reported in black. Complex I (CI), complex II (CII), complex III (CIII), and complex IV (CIV) are reported in green, yellow, magenta, and grey, respectively. Black circular arrows indicate cyclic pathways. Red arrows indicate impaired pathways or reactions. Green arrows indicate upregulated pathways or reactions. Black dashed lines indicate impaired reactions. Abbreviations: MIM: mitochondrial inner membrane; MOM, mitochondrial outer membrane; IMS, intermembrane space; AAC, ADP/ATP carrier; CAC, carnitine/acyl-carnitine carrier; ORC, ornithine carrier; AGC, aspartate/glutamate carrier; OGC, malate/2-oxoglutarate carrier; MAS, malate/aspartate shuttle; TCA, tricarboxylic acid cycle; Bax, Bcl-2 associated X protein;Bak, Bcl-2 antagonist/killer-1; Bcl-2, B-cell lymphoma-2; MPC, mitochondrial pyruvate carrier; UCP, uncoupling protein; CypD, cyclophilin D; CytC, cytochrome C; VDAC, voltage-dependent anion channel; AIF, apoptosis-inducing factor; mPTP, mitochondrial permeability transition pore.

