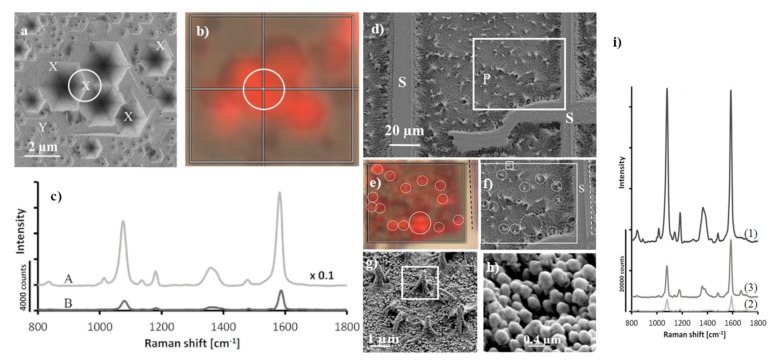
Figure 5.
(a,b) SEM images and corresponding SERS intensity map of the spectrum of p–mercaptobenzoic acid adsorbed on the surface of GaN/AuAg (plot represents intensity of the band at 1590 cm−1), (c) recorded SERS spectra of p–mercaptobenzoic from A: point indicated by white circle on (a) and B: point indicated as Y. (d,f–h) SEM images of photo-etched GaN samples, (e) SERS intensity map of the band at 1590 cm−1 of p–mercaptobenzoic acid and (i) SERS spectra of p–mercaptobenzoic acid recorded on substrates having various GAN morphologies: 1 nano-pillars, 2 on the matrix, 3 at the position matched as X in (a). Reprinted with permission from [37]. Copyright 2018 Elsevier.

