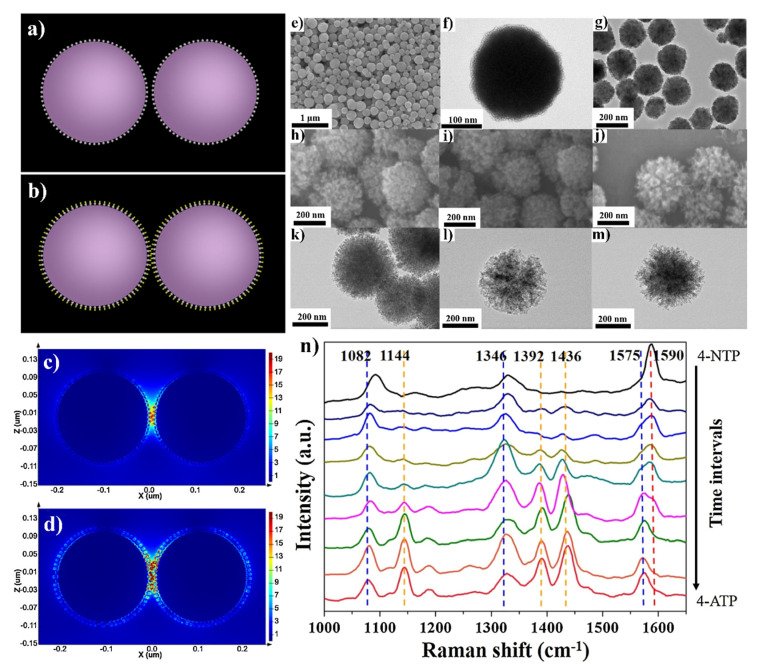
Figure 10.
(a) The simulation model of Fe3O4@TiO2@Ag and (b) Fe3O4@TiO2@AuAg nanoparticles, (c) the calculated electromagnetic field distribution around Fe3O4@TiO2@Ag and (d) Fe3O4@TiO2@AuAg nanoparticles. The incident light wavelength was 785 nm. (e) SEM images of Fe3O4 spheres, (f) TEM image of Fe3O4@TiO2 core–shell sphere, (g) SEM images of Fe3O4@TiO2@Ag sphere, (h–j) SEM images of Fe3O4@TiO2@AuAg nanospheres with various molar ratio of Ag:Au: (h) 1:2, (i) 1:1, (j) 2:1, (k–m) the corresponding TEM images, (n) SERS spectra illustrating the reduction of 4-nitrophenol to 4-aminophenol catalysed by Fe3O4@TiO2@Au-Ag nanospheres. Reprinted with permission from [51]. Copyright 2016 Elsevier.

