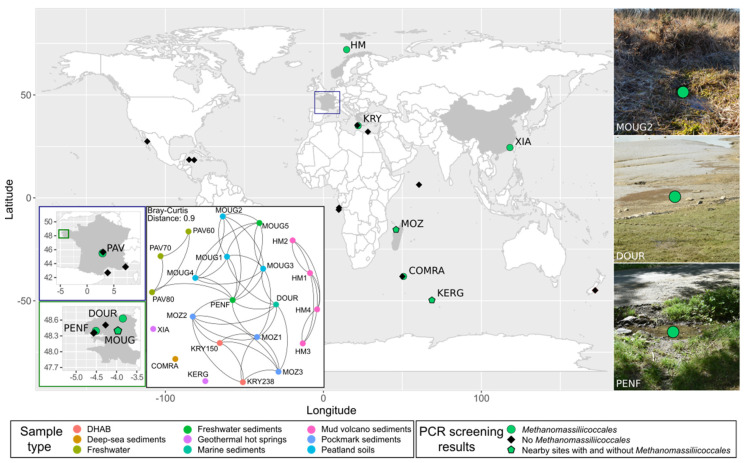
Figure 1.
Distribution of environmental samples screened for Methanomassiliicoccales. On the map, green dots indicate the presence of Operational taxonomic units (OTUs) assigned to Methanomassiliicoccales in the sample; black diamonds indicate samples in which no Methanomassiliicoccales was detected by PCR with primers targeting Methanomassiliicoccales. Green and black pentagons show the position of nearby sites characterized by the presence of Methanomassiliicoccales for some, and their absence for others. The Network based on Bray-Curtis index shows the dissimilarity in the composition of total microbial communities between samples; pictures on the right represent, respectively, the MOUG2, DOUD, and PENF sampling sites.

