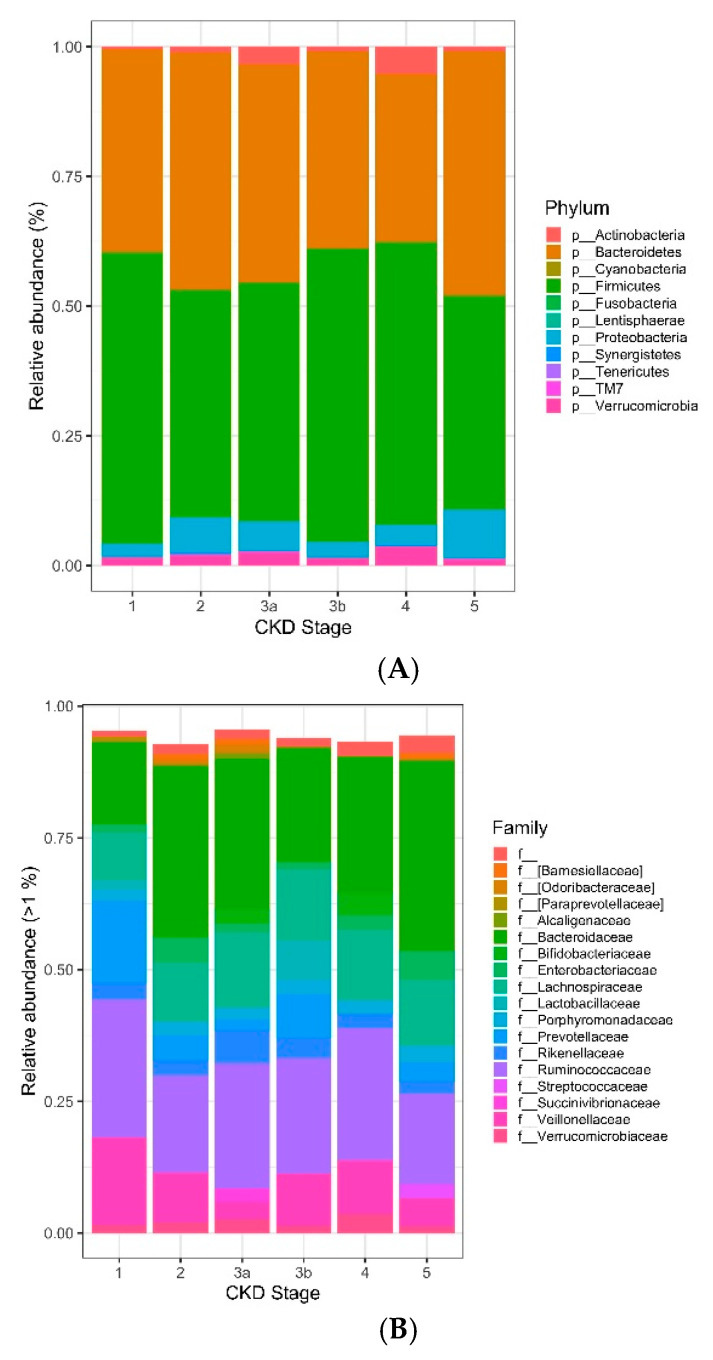
Figure 4.
(A). Stacked bar charts display the average relative abundance of bacterial operational taxonomic units (OTUs) identified to the taxonomic level of phylum in the gut microbiome of individuals with different stages of CKD disease. Abundances were calculated from trimmed data to remove OTUs that were prevalent in <2 samples with <2 counts in the complete dataset. (B). Stacked bar charts display the average relative abundance of bacterial operational taxonomic units (OTUs) identified to the taxonomic level of family in the gut microbiome of individuals with different stages of CKD disease. Abundances were calculated from trimmed data to remove OTUs that were prevalent in <2 samples with <2 counts in the complete dataset.

