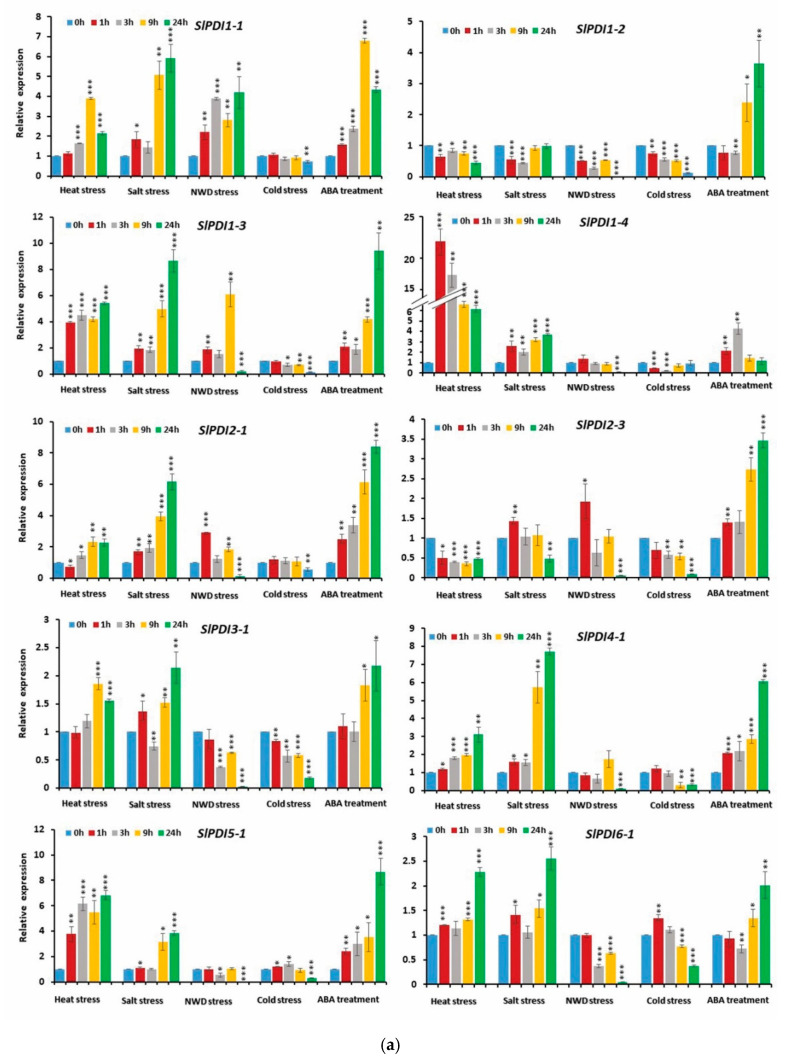
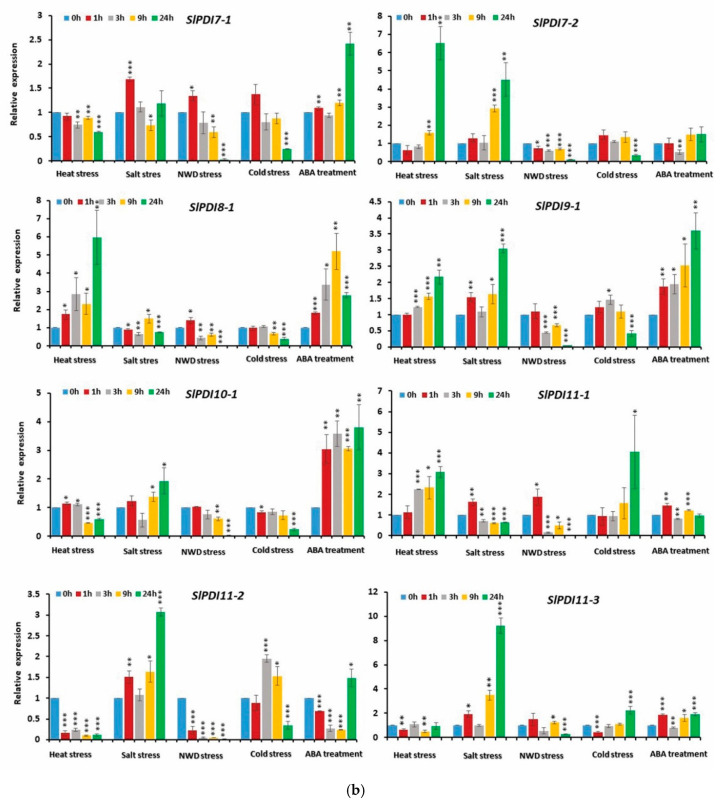
Figure 8.
(a,b). Relative expression levels of SlPDI genes in response to various abiotic stresses, viz., heat stress, salt stress, nutrient and water deficit (NWD) stress and cold stress, and phytohormone treatment. Error bars indicate the standard errors of the means of three replicates. *, ** and *** represent the significant difference at p-value ≤ 0.05, ≤ 0.01 and ≤ 0.001, respectively.


