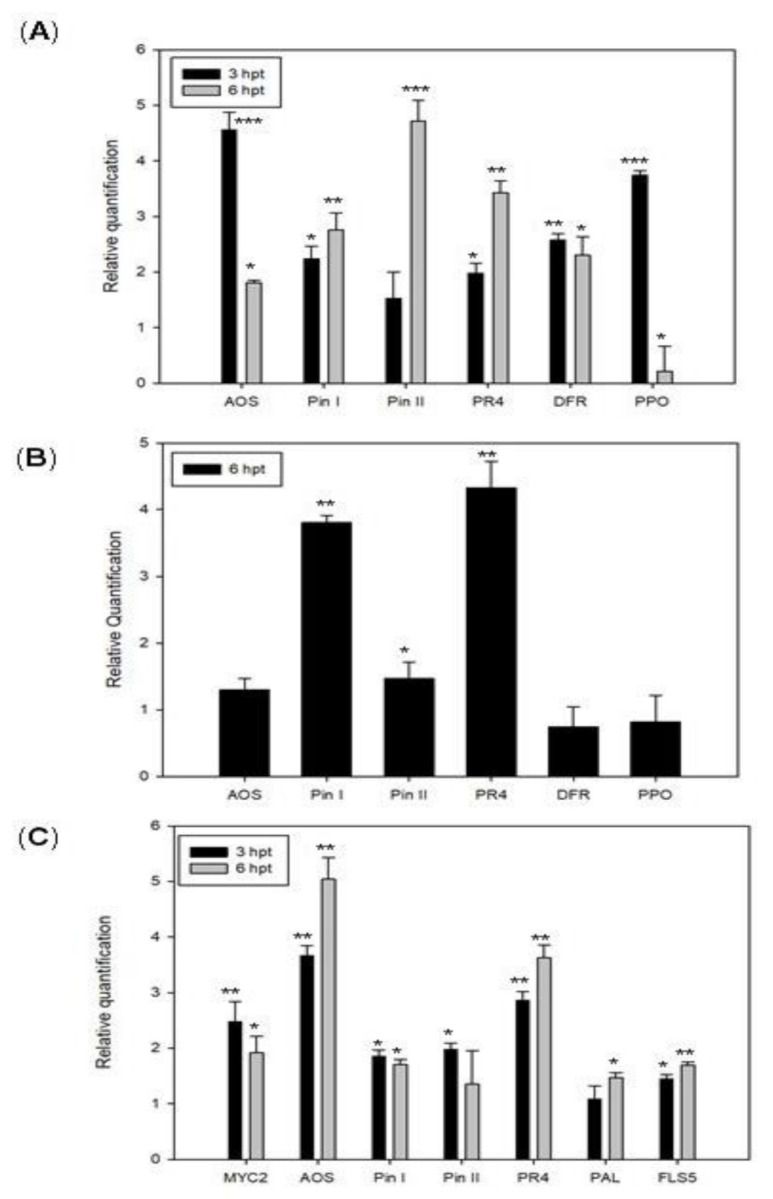
Figure 3.

Expression analysis of defense-related genes following Sys treatments (100 pM) on eggplants and grapevine plants. Relative gene expression of defense-related genes by qRT-PCR in eggplants-treated leaves (A), in leaves of eggplants grown in a hydroponic system (B) and in grapevine-treated leaves (C). Quantities are relative to the calibrator control condition, mock-treated plants. Asterisks indicate data statistical significance (Student’s t-test, * p < 0.05, ** p < 0.01, *** p < 0.001). Error bars indicate standard error.
