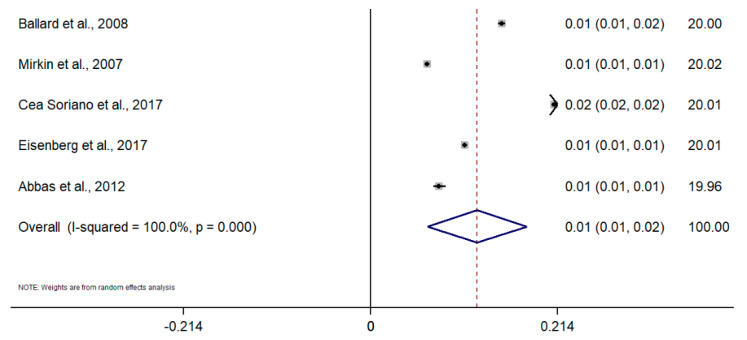
Figure 3.
Meta-analysis of the prevalence of endometriosis based on population-based integrated information systems. Note: black lines with squared dots—the prevalence with confidence intervals for each individual study; rhombus—pooled prevalence with confidence interval; red dotted line—line of no effect (studies crossing the line are not statistically different).

