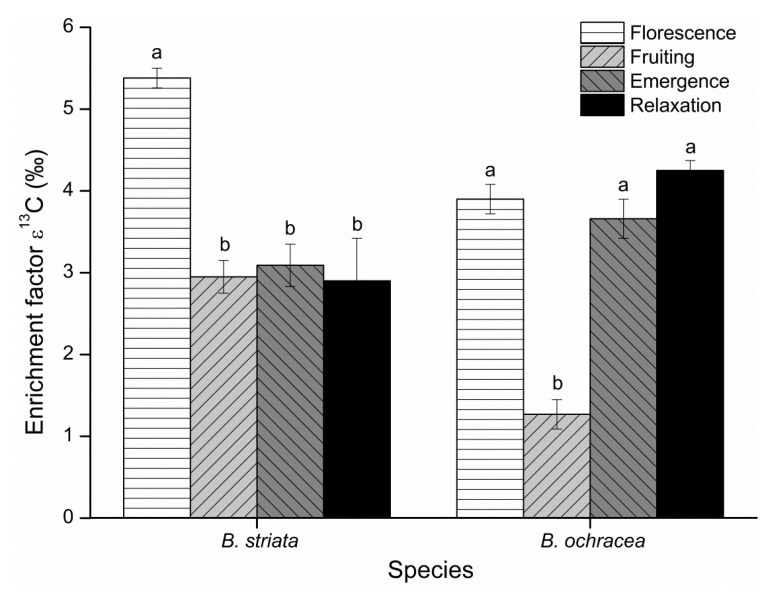
Figure 7.
Enrichment factor (ε) for 13C of Bletilla striata and B. ochracea collected at different phenological stages. Mean ε values of the autotrophic reference species are equal to zero. Different lowercase letters for each species indicate statistically significant differences among phenological stages (p < 0.05).

