Figure 4.
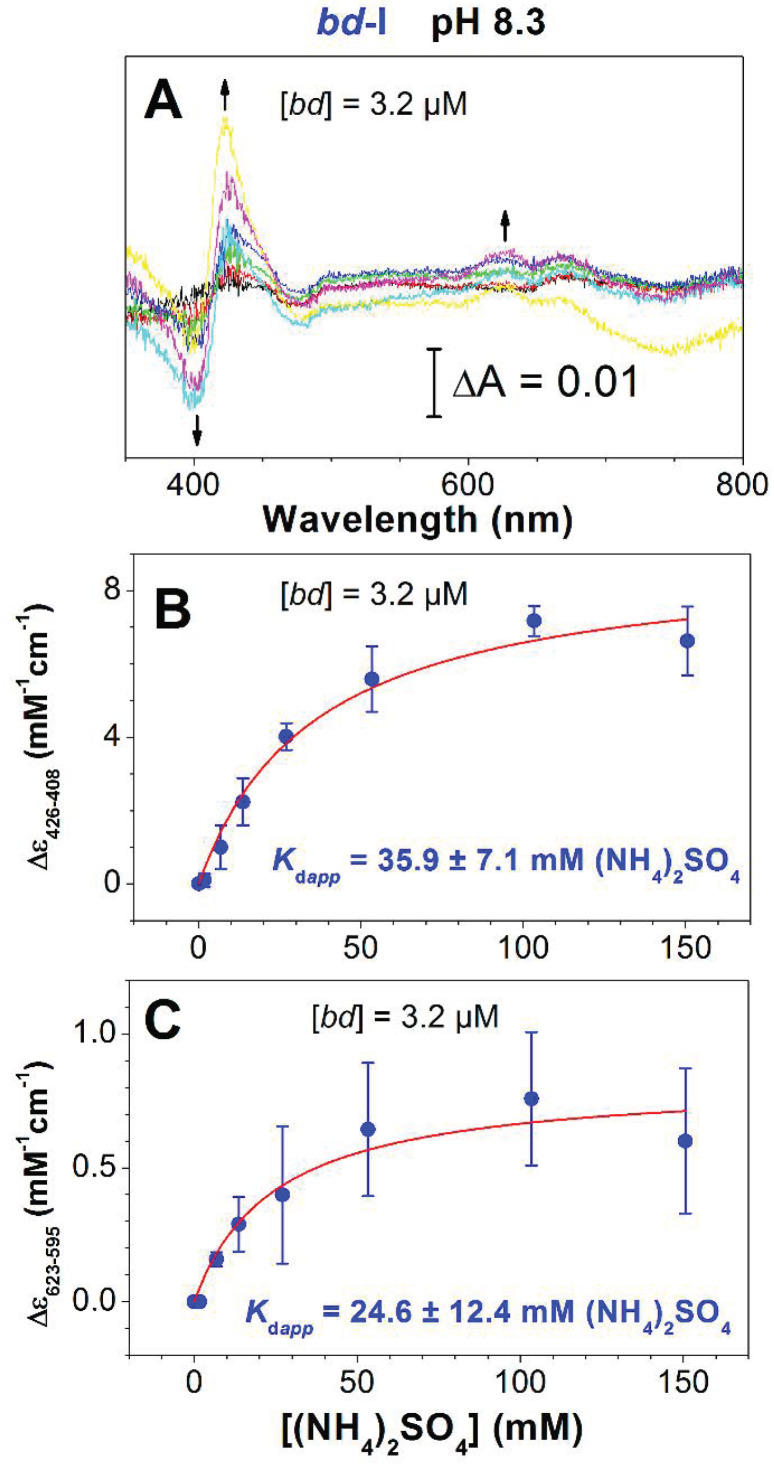
Absorbance changes of oxidized cytochrome bd-I induced by (NH4)2SO4. (A) Double difference absorption spectra of the isolated cytochrome bd-I (3.2 μM): each spectrum is a difference between two difference spectra, (NH4)2SO4-treated oxidized minus oxidized and K2SO4-treated oxidized minus oxidized at the same concentration of the sulfate. The arrows depict the direction of absorbance changes at increasing [(NH4)2SO4]. (B,C) Absorbance changes measured at 426–408 and 623–595 nm as a function of (NH4)2SO4. Experimental data (filled circles) are shown together with their best fits (solid lines) to the hyperbolic equation (see Materials and Methods), giving the values for maximum absorption changes at 426–408 and 623–595 nm Amax of 8.9 ± 0.6 and 0.8 ± 0.1 mM−1cm−1 and Kdapp of 35.9 ± 7.1 and 24.6 ± 12.4 mM (NH4)2SO4 (7.2 ± 1.4 and 4.9 ± 2.5 mM NH3), respectively (mean ± standard deviation, n = 3; R2 = 0.94547 (Soret region), R2 = 0.69231 (visible region)).

