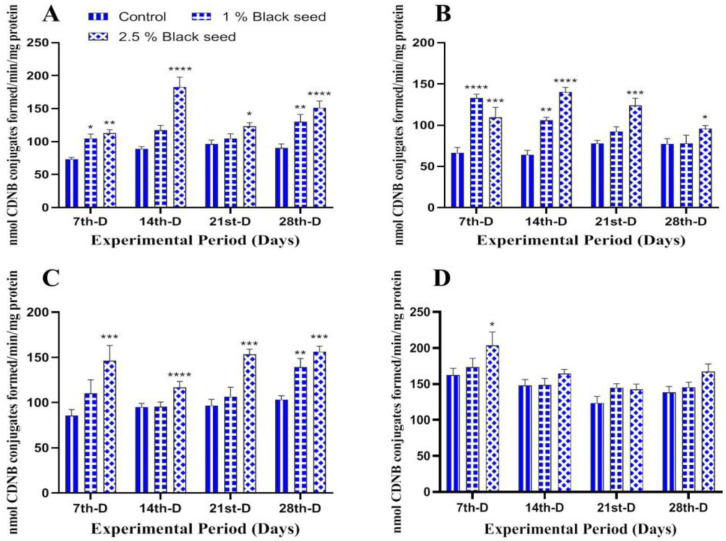
Figure 3.
Glutathione-S-transferase activity in liver (A), kidney (B), gills (C) and brain (D) of rohu fed black seed supplemented diets for 28 days. Each value represent the mean ± S.E.M (n = 5). Columns with different asterisk are statistically different (* p < 0.05, ** p < 0.01, *** p < 0.001 and **** p < 0.0001).

