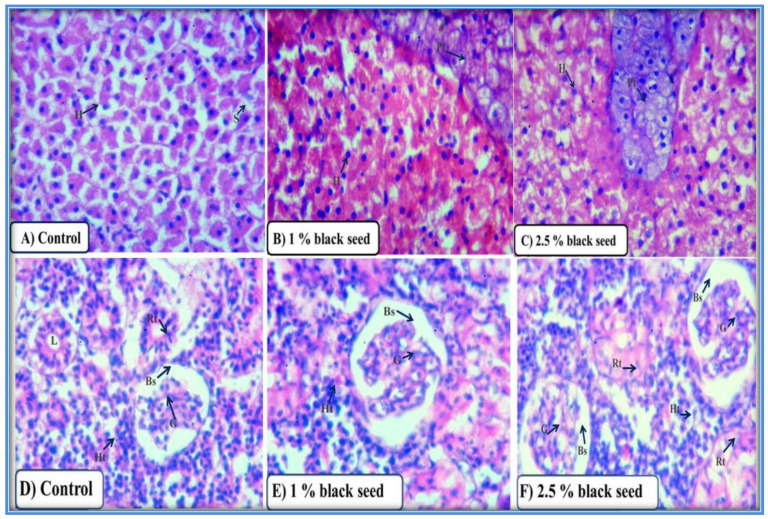
Figure 6.
Photomicrographs of liver (A–C) and kidney (D–F) sections of rohu from control and black seed supplemented groups at 28th day of the experiment. (H) hepatocytes, (S) sinusoids, (Pt) pancreatic tissue, (G) glomerulus, (Bs) bowmen’s space, (Rt) renal tubule, (L) lumen and (Ht) hematopoietic tissue. H & E, 400X.

