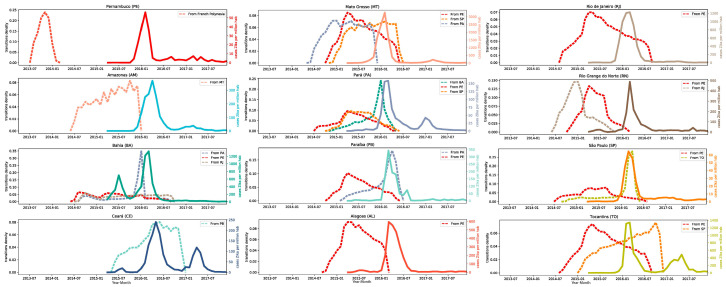
Figure 5.
ZIKV transition dynamics between Brazilian states and epidemic history. Each panel shows the number of viral transitions through time, as estimated by Markov Jumps analysis, (dashed lines) colored according to the state of origin and the number of confirmed cases per million habitants (solid line).

