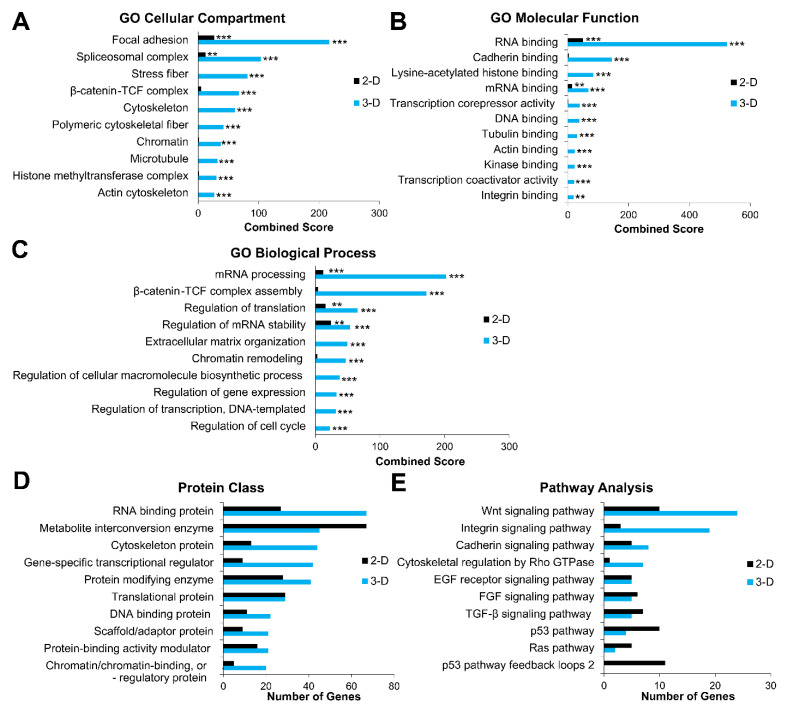
Figure 5.
Gene ontology analysis of differentially expressed genes in naïve ESCs cultured under 2-D and 3-D conditions. (A–C) Enrichr and (D,E) protein analysis through evolutionary relationships (PANTHER) analysis of differential gene expression with Benjamini–Hochberg false discovery rate (FDR) < 0.05 as determined by DESeq2 analysis. (A–C) Gene ontology (GO) term enrichment analysis depicting upregulated differentially expressed genes (DEGs) associated with the cellular compartment, molecular function, and biological processes, respectively. The x-axis represents the combined score (p-value multiplied by the z-score) generated by Enrichr (** p ≤ 0.01, and *** p ≤ 0.001). (D,E) Upregulated protein classes and pathways associated with 2-D in 3-D cultured Elf1 cells according to PANTHER analysis, respectively. The x-axis represents the number of genes associated with each category.

