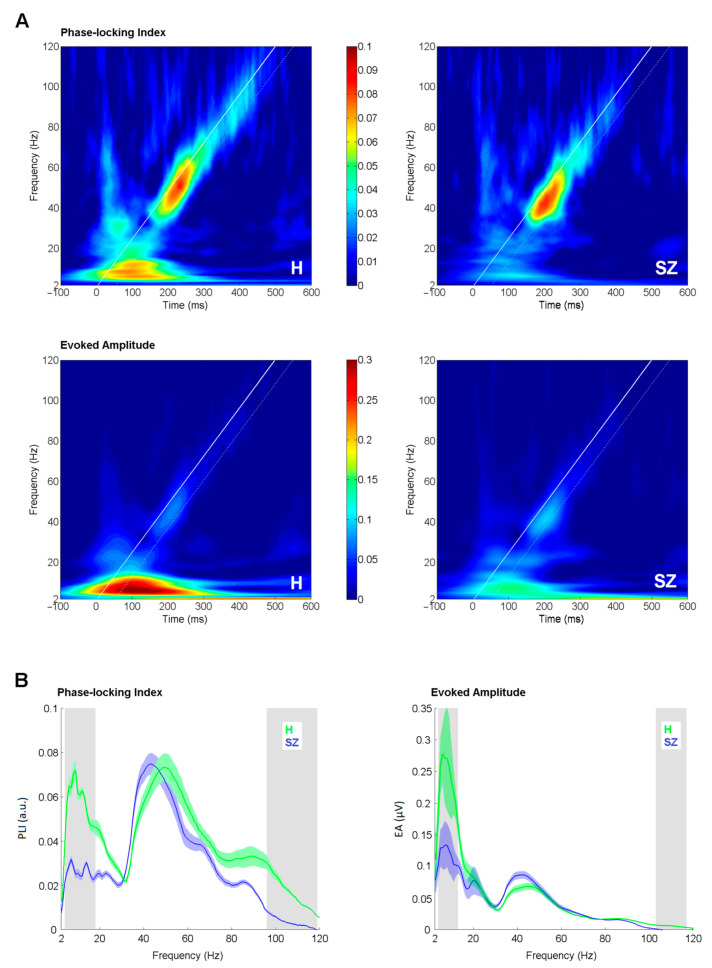
Figure 2.
Comparison of envelope following response (EFR) measures between groups. (A) Time-frequency plots of phase-locking index (upper panel) and evoked amplitude (lower panel) in healthy controls (H) and schizophrenia patients (SZ) as an average of Fz and Cz electrodes. White bold line corresponds to the stimulation timing; white dashed line denotes +50 ms window of the analysis. (B) Phase-locking index and evoked amplitude curves as an average of Fz and Cz electrodes. The shaded color areas around the curve represent standard errors. The significantly different frequency windows, as assessed by the bootstrap, are marked by grey shaded areas. Green stands for healthy controls (H); blue stands for schizophrenia patients (SZ).

