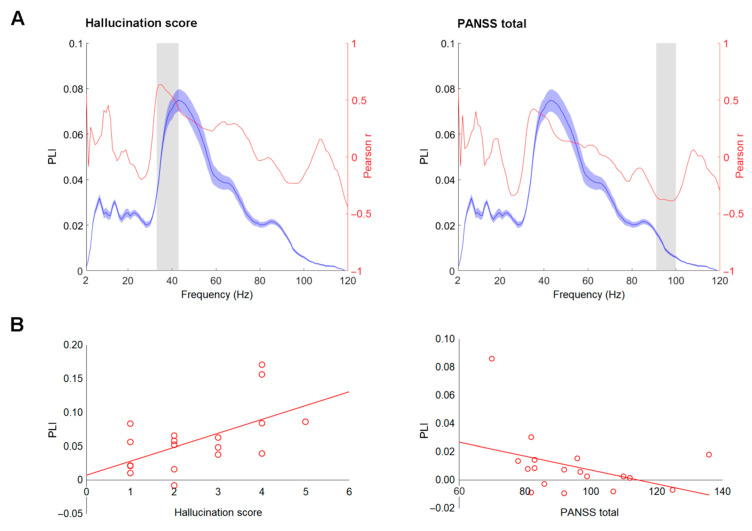
Figure 3.
Correlation between envelope following responses (EFR) measures and clinical variables. (A) Phase-locking index (PLI) curves (blue) and Pearson r values (red) between PLI and hallucination scores and Positive and Negative Syndrome Scale (PANSS) total scores in schizophrenia group. The shaded blue areas around the curve represent standard deviations. The frequency windows where significant correlation was observed, as assessed by the bootstrap, are marked by grey shaded areas. (B) Scatterplots of PLI values averaged within the significant window (depicted in part A) against hallucination and PANSS total scores.

