Figure 5.
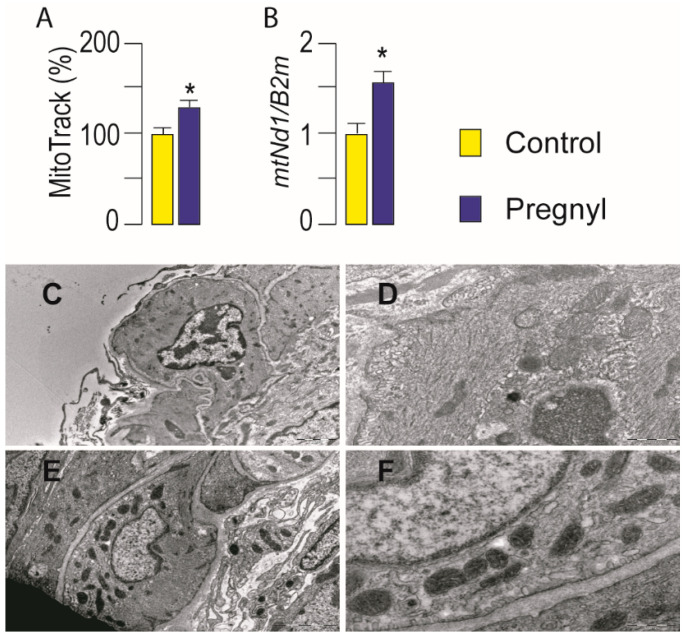
Activation of LHR increased mitochondrial mass and changed Leydig cell’s mitochondrial ultrastructure. Two hours after hCG injection testes were isolated, fragments of testicular tissue immediately fixed for transmission electron microscopy (TEM) analysis while the rest of the tissue was used for Leydig cells isolation. Cells, individually isolated, were plated for mitochondrial abundance determination (105/well) using Mitotracker green (A) or for genomic DNA isolation (106/well) (B). The mtNd1/B2m ratio was used for mtDNA content determination. Ultramicrographs of Leydig cell from control rats at low (89,000×; C) and high magnification (28,000×; D) with well preserved mitochondria, and Leydig cell from hCG-treated rats at low (56,000×; E) and high magnification (28,000×; F) with numerous mitochondria with electron dense matrix. Data bar represents group means ± SEM values from three rats (n = 3). * Statistical significance at level p < 0.05 compared to the untreated group.

