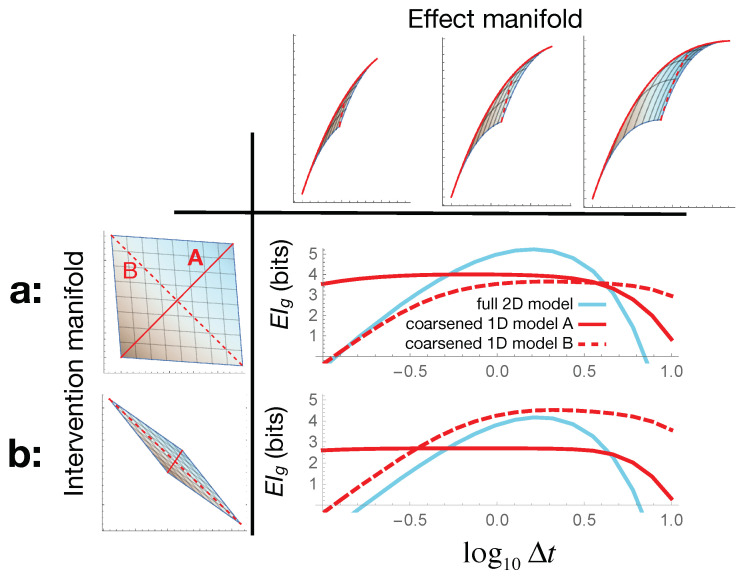
Figure 4.
The optimal model choice depends on both the effects we choose to measure and the intervention capabilities we have. Horizontally, we vary the time-scale on which we measure the bacterial population dynamics in our toy model (Section 4): the top row shows how this changes the shape of our effect manifold. (a) shows the results when our intervention capabilities are nearly in direct correspondence with the parameters . Here, the plot shows that varying takes us through three regimes: with submanifold A as the optimal model at early times, the full 2D model optimal at intermediate times, and submanifold B most informative at late times. (b) shows that this entire picture changes for a different set of intervention capabilities—illustrating that the appropriate model choice depends as much on the interventions as on the effects.

