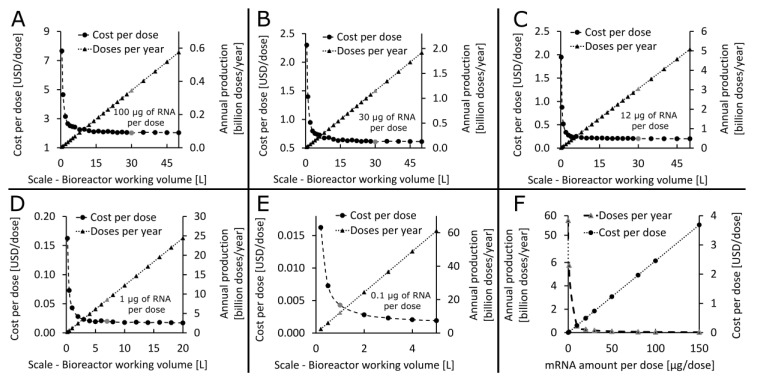
Figure 2.
Determining the techno-economically feasible production scale for five vaccines with varying RNA amount per dose listed in Table 1. The entire process is scaled up proportionally and the scale is indicated by the bioreactor working volume. (A) Identifying the techno-economically feasible production scale for a 100 µg/dose RNA vaccine with modified UTPs. The annual production amounts and the drug substance production cost per dose is plotted in function of the scale of the production process. The scale identified as technologically feasible and economically viable corresponds to the 30 L bioreactor working volume and the corresponding key performance indicators (KPIs) of annual production and cost per dose values are shown by the grey dot and triangles, respectively. (B) Determining the suitable production scale for a 30 µg/dose RNA vaccine with modified UTPs. Plotting the annual production amounts and cost per dose in function of production scale identified the techno-economically feasible scale at 30 L bioreactor working volume, corresponding KPIs are indicated by the grey dot and triangle. (C) Determining the suitable production scale for a 12 µg/dose RNA vaccine with wild-type UTPs. Plotting the annual production amounts and cost per dose in function of production scale identified the techno-economically feasible scale at 30 L bioreactor working volume, corresponding KPIs are indicated by the grey dot and triangle. (D) Determining the suitable production scale for a 1 µg/dose RNA vaccine with wild-type UTPs. Plotting the annual production amounts and cost per dose in function of production scale identified the techno-economically feasible scale at 7 L bioreactor working volume, corresponding KPIs are indicated by the grey dot and triangle. (E) Determining the suitable production scale for a 0.1 µg/dose RNA vaccine with wild-type UTPs. Plotting the annual production amounts and cost per dose in function of production scale identified the techno-economically feasible scale at 1 L bioreactor working volume, corresponding KPIs are indicated by the grey dot and grey triangle. (F) The impact of the RNA amount per vaccine dose on the annual production amounts and cost per dose.

