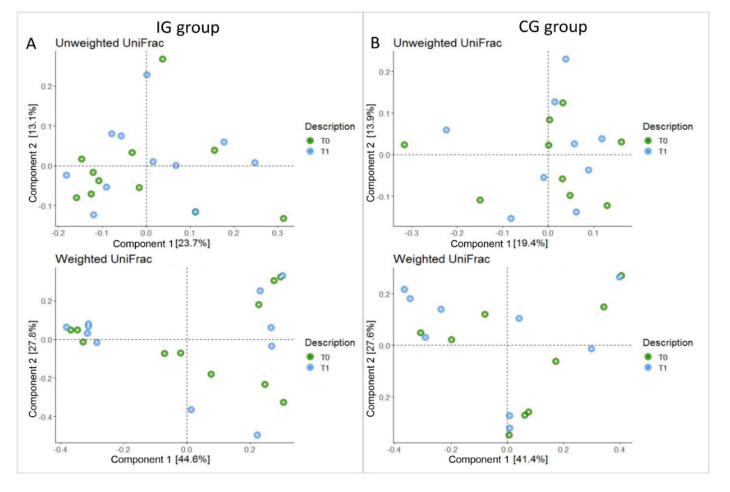
Figure 2.
Principal component analysis plot (PCA) of the bacterial communities using UniFrac algorithm. Axes represent the first two components from the principal coordinate (PCo) analysis, based on the phylogenetic distance between operational taxonomic units (OTU) representative sequences. (Panel A): UniFrac unweighted PCoA and weighted plots of IG group. (Panel B): unweighted and weighted UniFrac PCoA plots of CG group. T0 and T1 refer to baseline and four months of synbiotics administration, respectively.

