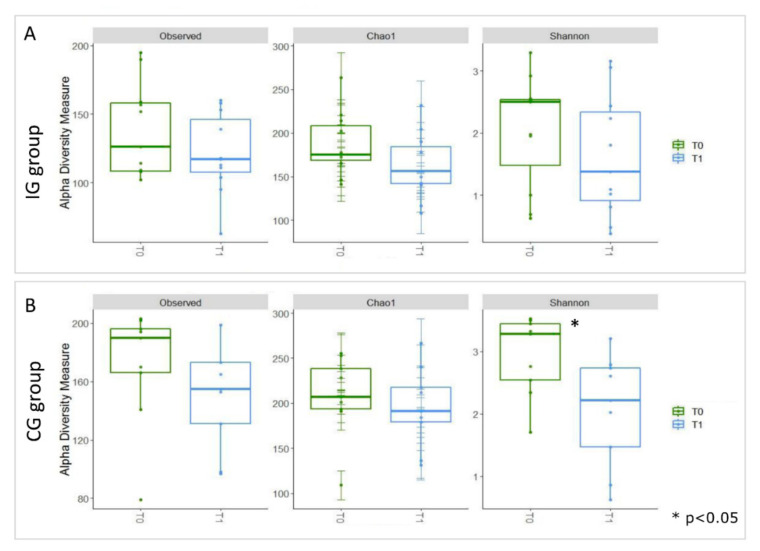
Figure 3.
Boxplots representing α-diversity indices. The box plots represent the Observed, Chao1, and Shannon index-es for samples stratified for T0 and T1 in the IG (A) and CG (B) groups. The interquartile range is represented by the box, and the line in the box is the median. The whiskers indicate the largest and the lowest data points, respectively, while the dots symbolize outliers. The asterisk * indicates a p-value < 0.05.

