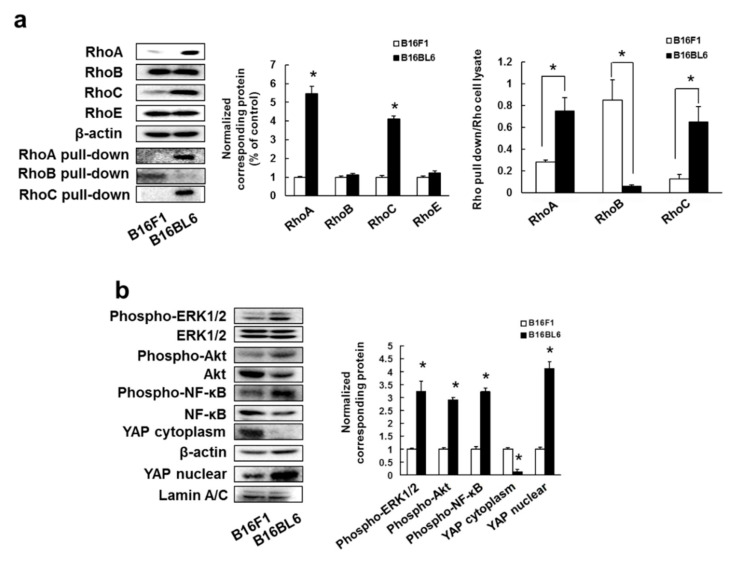
Figure 1.
B16BL6 cells enhanced expression and activation of RhoA and RhoC: (a) Images of Western blots for the RhoA, RhoB, RhoC, RhoE, RhoA-GTP form (RhoA pull-down), RhoB-GTP form (RhoB pull-down), RhoC-GTP form (RhoC pull-down) and β-actin (internal standard), and quantification of the amounts of RhoA, RhoB, RhoC, RhoE, RhoA pull-down, RhoB pull-down, and RhoC pull-down after normalization to the amounts of corresponding protein. The results are representative of 4 independent experiments. * p < 0.01 vs. B16F1 cells (ANOVA with Dunnett’s test); (b) Images of Western blots for the phospho-ERK1/2, ERK1/2, phospho-Akt, Akt, phospho-NF-κB, NF-κB, YAP, β-actin, and lamin A/C, and quantification of the amounts of phospho-ERK1/2, phospho-Akt, phospho-NF-κB, and YAP after normalization to the amounts of corresponding protein. The results are representative of 4 independent experiments. * p < 0.01 vs. B16F1 cells (ANOVA with Dunnett’s test).

