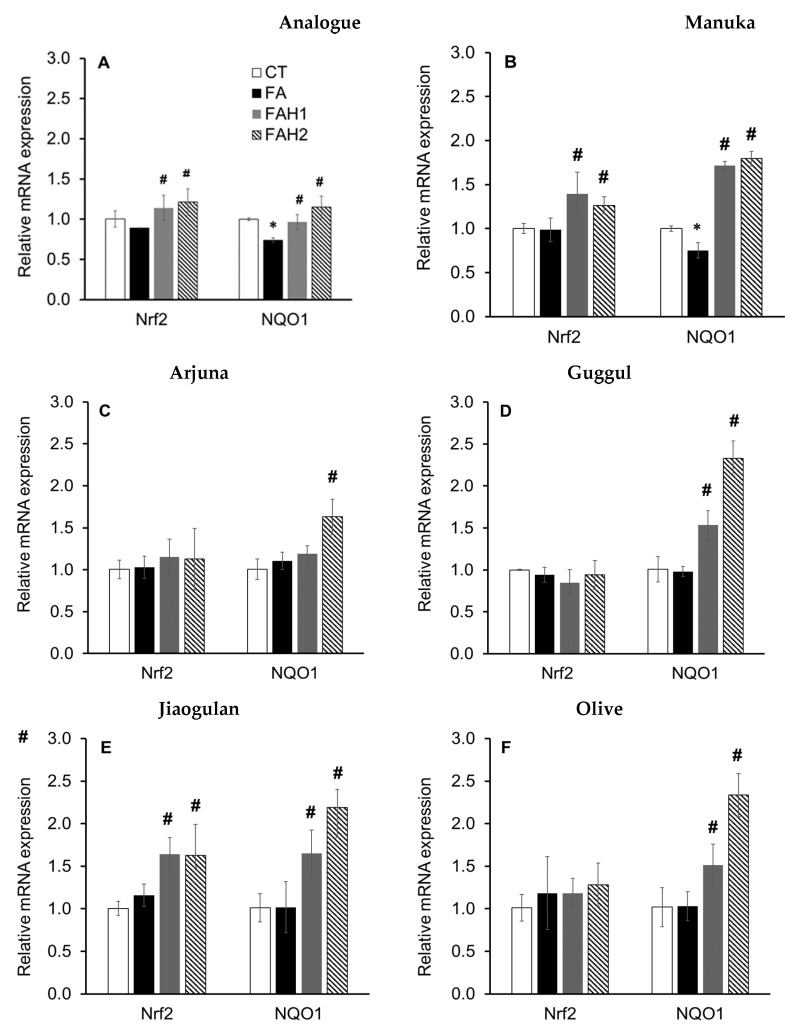
Figure 4.
The expression of genes associated with antioxidant defense response in fatty acid-induced HepG2 cells incubated with the tested honeys after 24 h. Results are mean ± SD of four replicates; *: p < 0.05 vs. control and #: p < 0.05 vs. fatty acid-treated cells, analyzed by one-way ANOVA followed by Duncan’s multiple comparison test. (A): Analogue, (B): manuka; (C): arjuna, (D): guggul, (E): jiaogulan, (F): olive honey. CT: Control without fatty acid and honey, FA: 1 mM fatty acid treatment, FAH1: 1 mM fatty acid and 1.0% honey; FAH2: 1 mM fatty acid and 2.0% honey (w/v).

