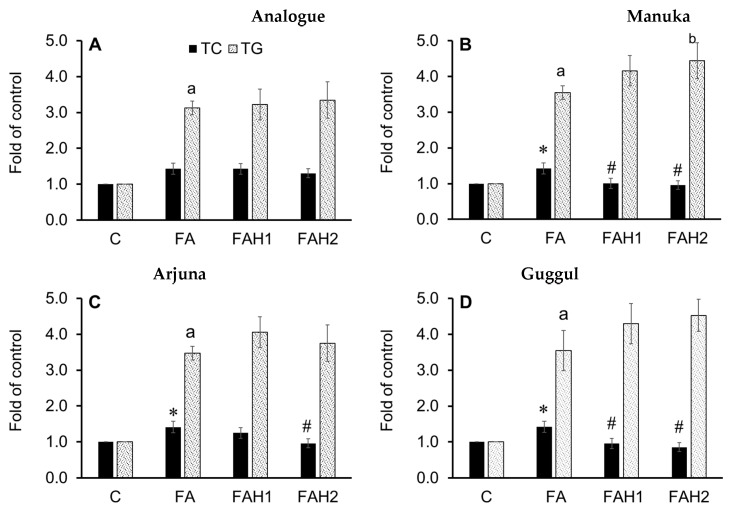
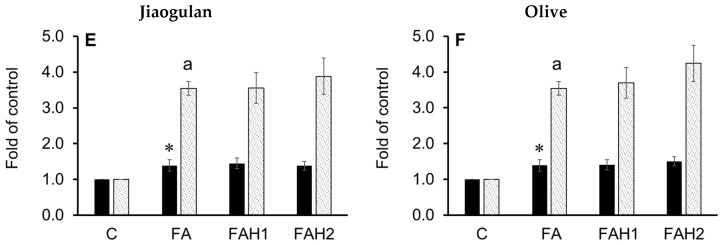
Figure 5.
Total cellular cholesterol (TC) and triglyceride (TG) content in fatty acid-induced HepG2 cells incubated with the tested honeys after 24 h. C: Control cells, FA: fatty acid treatment, FAH1: fatty acids and honey 1.0%, FAH2: fatty acids and honey 2.0%. Results are mean ± SD of four replicates; *: p < 0.05 vs. control and #: p < 0.05 vs. fatty acid-treated cells for TC; a: p < 0.05 vs. control and b: p < 0.05 vs. fatty acid-treated cells for TG. Data were analyzed by one-way ANOVA followed by Duncan’s multiple comparison test. (A): Analogue, (B): manuka; (C): arjuna, (D): guggul, (E): jiaogulan, (F): olive honey.


