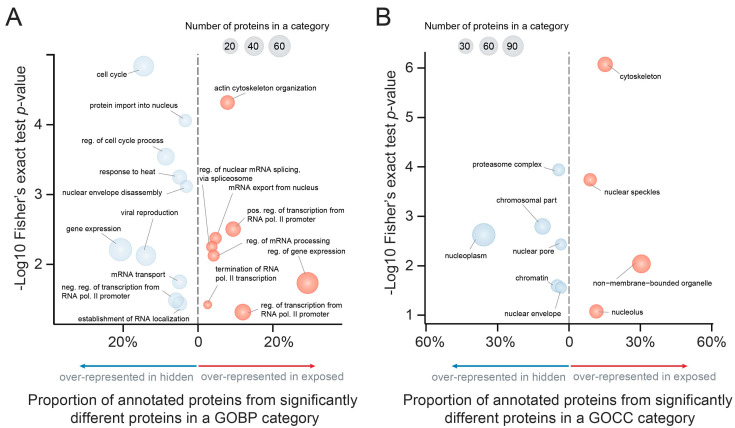
Figure 3.
Gene ontology analysis of PIP2-effectors based on (A) biological process (GOBP) and (B) cellular compartment (GOCC). Bubble charts represent ‘exposed’ and ‘hidden’ proteins using all quantified proteins as a background reference set. X-axis shows the proportion of proteins from a gene ontology (GO) category from all proteins in the ‘exposed’ (red) or ‘hidden’ (blue) group. Y-axis shows the -log10 p-value estimated using Fisher’s exact test. The size of the bubble corresponds to number of proteins.

