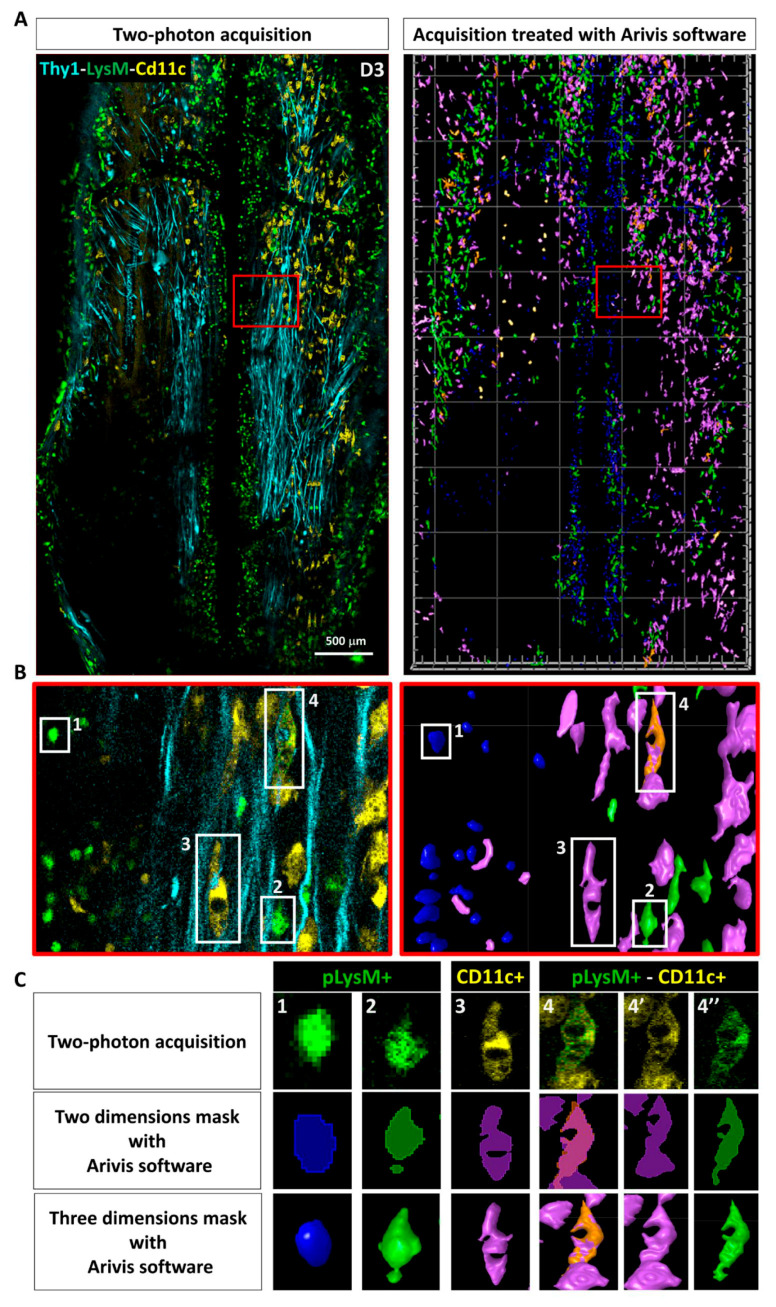
Figure 4.
Automated image analysis pipeline used to characterize post-traumatic immune response. (A) Dorsal view obtained by intravital 2P microscopy 3 days after PUDQL in Thy1-CFP//LysM-EGFP//CD11c-EYFP triple transgenic mouse (left), and its corresponding 3D volume rendering following segmentation and labelisation of the cells using Arivis software (right). (B) Zoom in of the red squared area of (A) showing the four types of immune cells detected in the spinal axonal network. Raw data (left) and corresponding segmented images (right) (C) typical examples of each cell type presenting the raw 2P maximal intensity projection image, its 2D mask and 3D volume rendering obtained at the end of our Arivis analysis pipeline. 4-4’-4’’ show a double labelled pLysM+/CD11c+ cell in the multicolor image (4) as well as in each EYFP (4’) and EGFP (4’’) channels that were analysed independently prior to making mask intersection.

