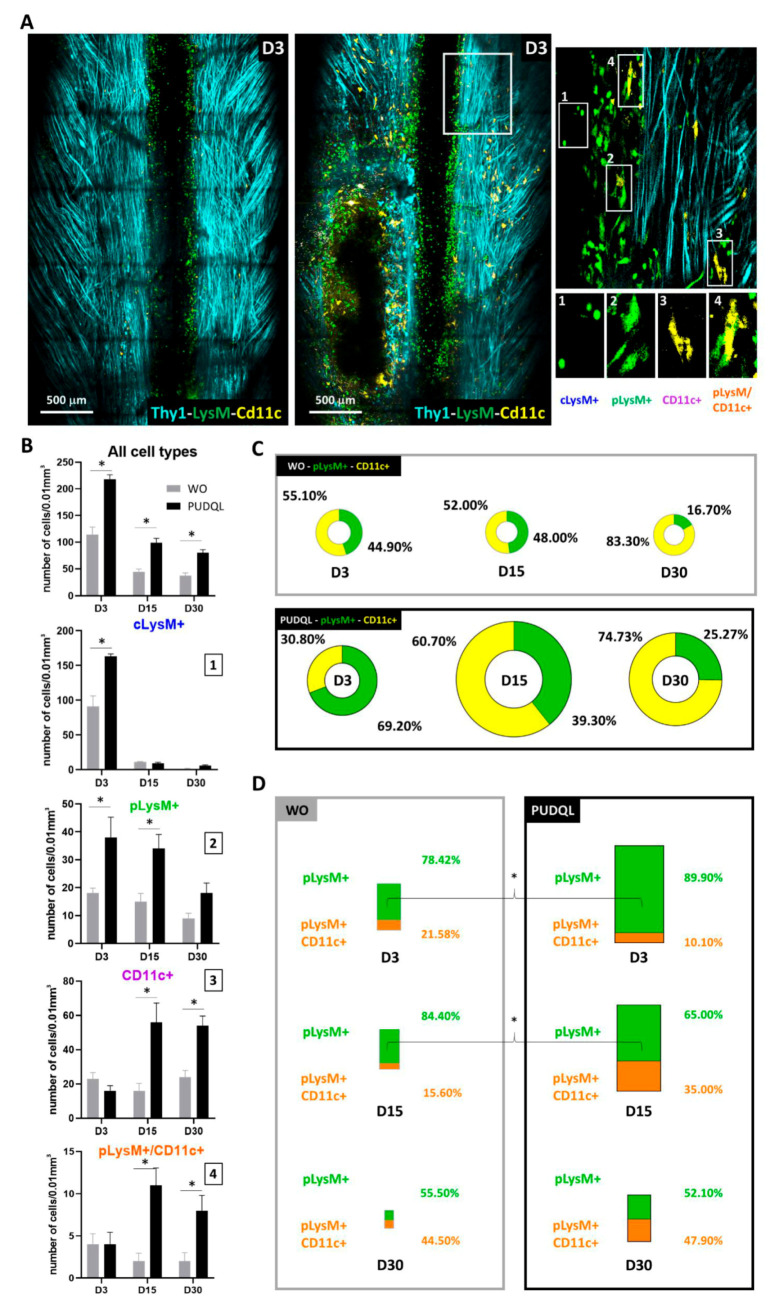
Figure 5.
Characterisation of immune cells response after PUDQL in triple fluorescent mice. (A) Representative maximal intensity projection of 2P images obtained in vivo three days (D3) after PUDQL or window implantation only (WO). Note the massive axonal degeneration (dark area) underlined by immune cell accumulation following PUDQL (bottom left corner) in comparison to a contralateral area (top right white square). High magnification image of the white square showing the four identified cell types. (B) Quantitative evolution of global fluorescent cells densities (top) or individual subsets (1–4) in PUDQL (n = 5) and WO (n = 3) animals. Data are shown as mean ± SEM. (C) Circular graphs showing the relative percentage of pLysM+ and CD11c+ cells 3, 15 and 30 days after window implantation with or without PUDQL. Diameter of the circles is proportional to the total number of pLysM+ and CD11c+ cells densities quantified at each time point. (D) Bar graphs showing the relative percentage of pLysM+/CD11c+ cells among pLysM+ cells 3, 15 and 30 days after window implantation with or without PUDQL. Height of the bar is proportional to the total number pLysM+ and pLysM+/CD11c+. * p < 0.05.

