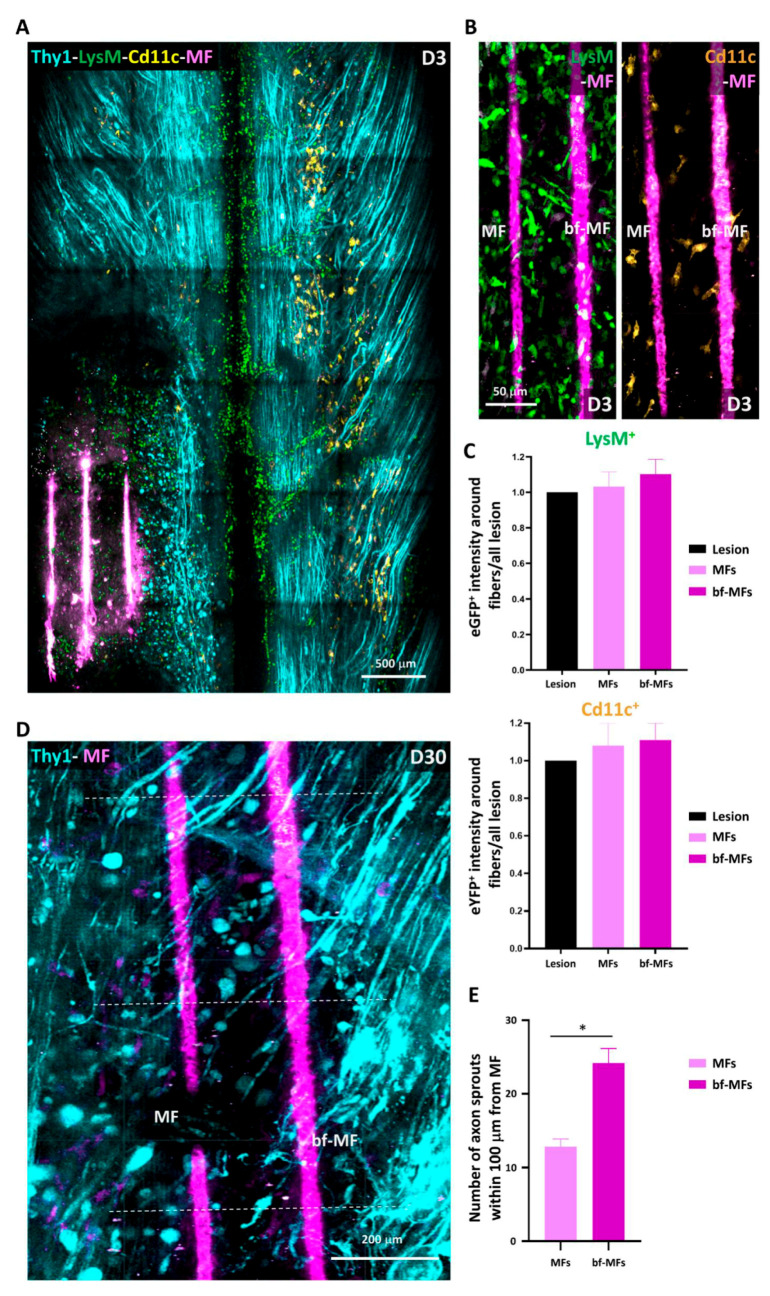
Figure 6.
Biocompatibility of carbon microfibres and the effect of protein-coating. (A) Representative maximal intensity projection 2P images obtained in vivo three days after PUDQL followed by implantation of Microfibres (MFs, pink). Note the only mild accumulation of inflammatory cells inside the lesion. (B) Even distribution of LysM+ and CD11c+ in the vicinity of MFs three days after PUDQL. Note the absence of accumulation on the surface of MF in the presence (bf-MF) or absence (MF) of protein coating. (C) Average fluorescence intensity of EGFP or EYFP in a 100 µm box centered on the MFs. Fluorescence was normalized to the average level encountered in the whole lesioned area. (nbf = 13, nbare = 9 out of 7 mice) (D) High magnification image of the lesion site 30 days after PUDQL. Axon density was higher in the vicinity of coated MFs (bf-MF) than non-coated ones (MFs), in particular at levels where axons sprouts were counted (dotted lines). (E) Average number of axons sprouts counted within the first 100 µm from the bf-MF or MF surface. Data are shown as mean ± SEM (nbf = 11; nbare = 6).* p < 0.05.

