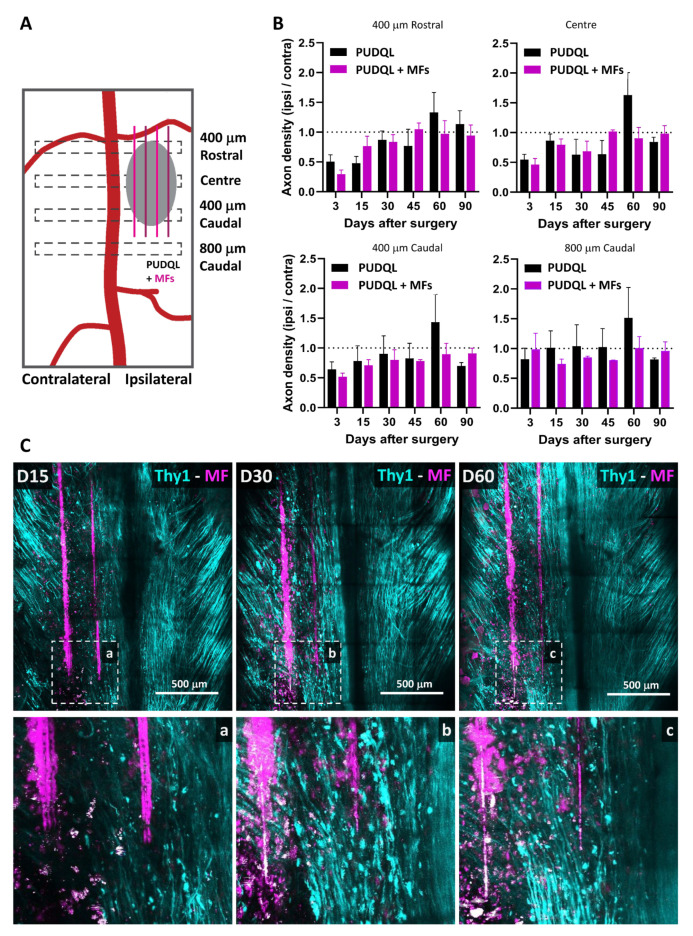
Figure 7.
Effects of MFs on axon growth and guidance. (A) Schematic representation of the regions where axons were counted relatively to the location of the PUDQL+ MFs. (B) Comparative evolution of the normalized axonal density over 90 days after PUDQL (black; n = 5) or PUDQL followed by MF implantation (pink; n = 5). The increased sprouting observed on day 60 (D60) in PUDQL mice was greatly reduced with MF implantation. Data are shown as mean ± SEM. (C) Representative images of the same region of the spinal cord 15, 30 and 60 days following PUDQL. High magnification image of the same region outlined by a dotted square (bottom a, b and c). Note that the damaged axonal network at D30 was replaced by a dense and straight array of axons gradually regenerating and densifying along MFs over two months.

