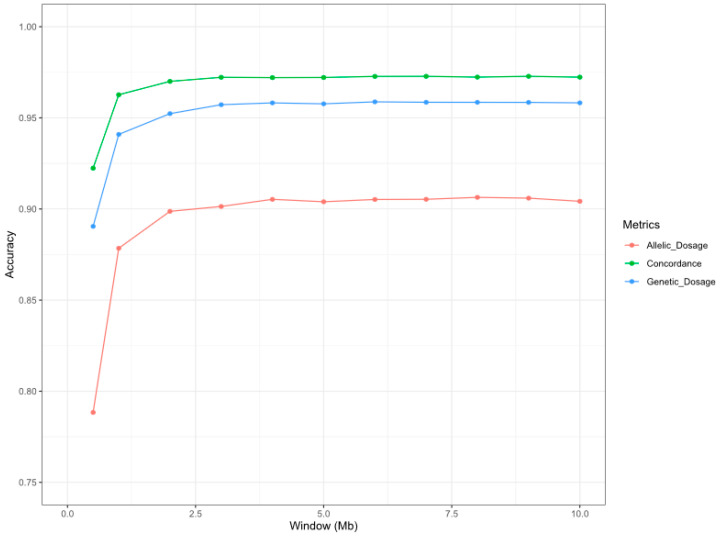
Figure 1.
Graphical representation of the accuracy of the microsatellite imputation considering different window lengths in the imputation process. The x-axis represents the window sizes (in bp) considered in the imputation process. The y-axis represents the average of the imputation accuracy parameters (concordance (green), genotype dosage (blue), and allelic dosage (orange)) of the 19 microsatellites included in this study.

