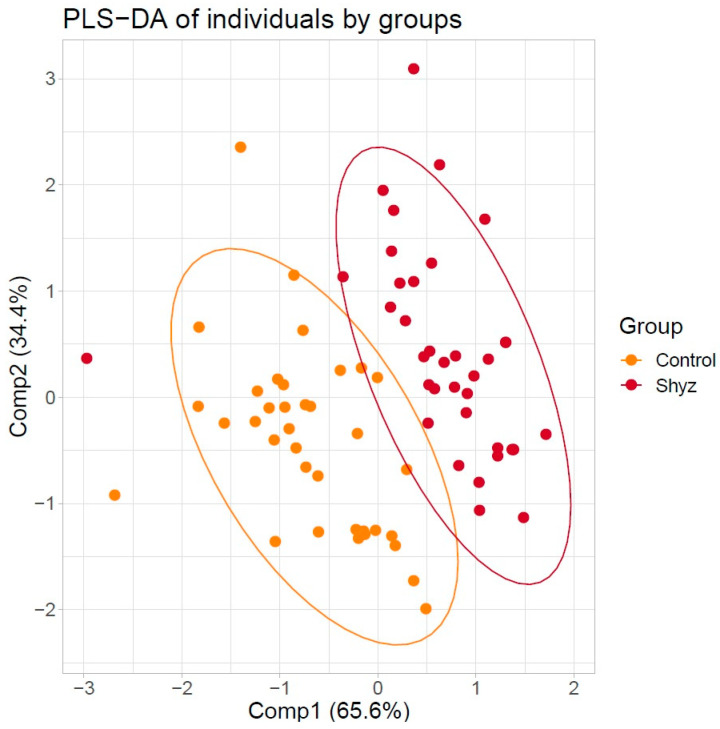
Figure 2.
Scatter plot of 73 individuals by the first two principal components extracted from amino acids and acylcarnitines concentrations by partial least squares discriminant analysis (PSL-DA). Two distinct clusters were noted. Clusters are marked using red color for group patients with schizophrenia and orange color for healthy individuals.

