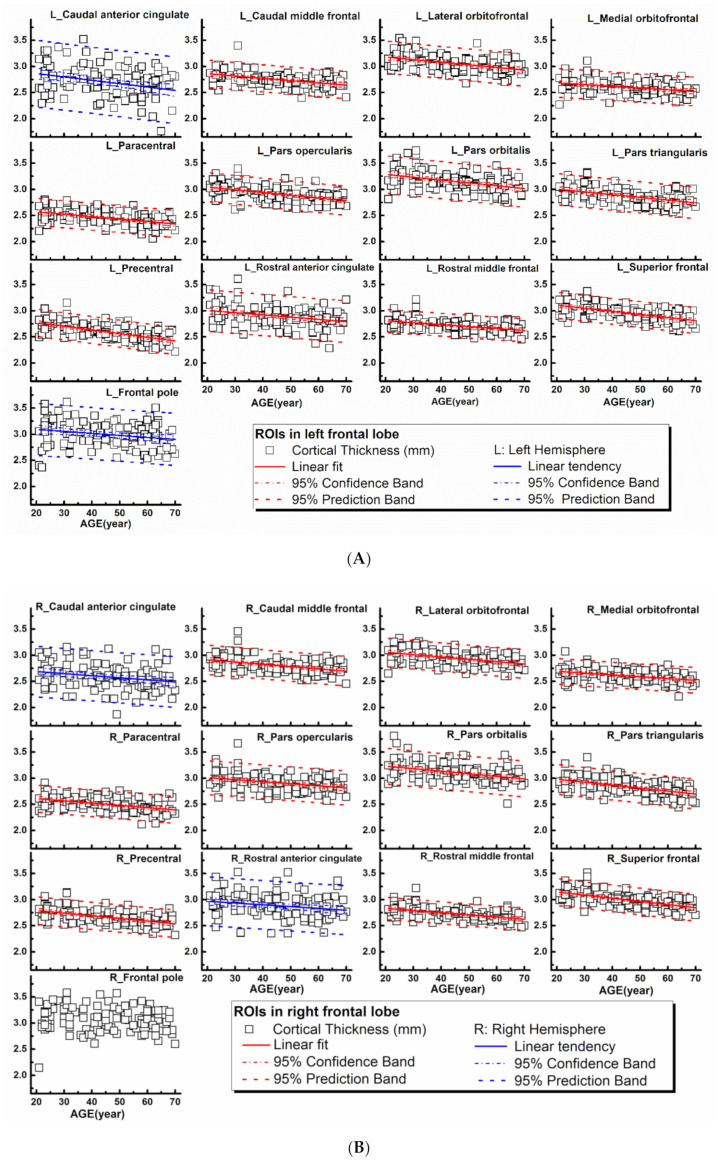
Figure 1.
Regional cortical thicknesses (y-axis, in mm) measured from frontal regions of interest (ROIs) plotted versus age (x-axis). Corresponding linear fits, the calculated 95% confidence interval bands, and the 95% prediction interval bands were also shown in 25 ROIs, where a significant (p < 0.0007, 21 ROIs with red lines) or a trend of (0.0007 < p < 0.05, 4 ROIs with blue lines) correlation between the measured values and the age was found.

