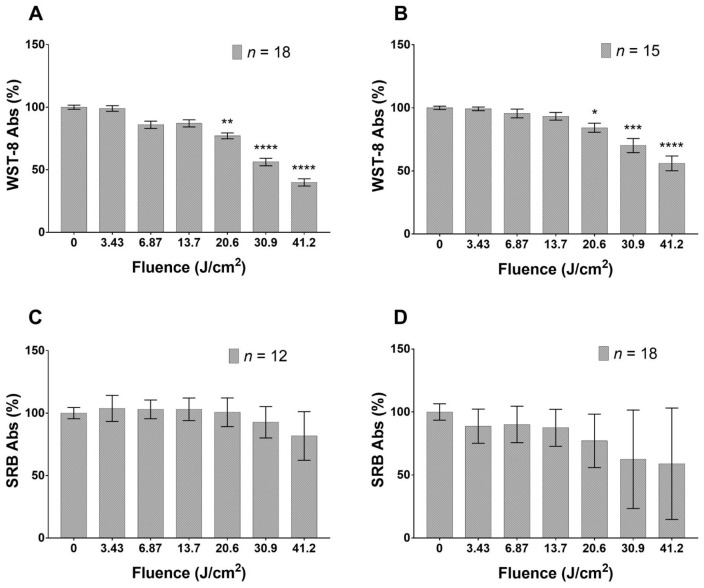
Figure 1.
Effects of blue LED light on metabolism and proliferation of HaCaT cells: (A,B) cell metabolism 24 and 48 h after treatment, respectively; and (C,D) proliferation 24 and 48 h after treatment, respectively. Data are expressed as mean ± SD. Each measure is repeated in duplicate for each condition. Statistical analysis: * p < 0.05; ** p < 0.01; *** p < 0.001; **** p < 0.0001 vs. control (not irradiated cells), Kruskal–Wallis test followed by Dunn’s post-hoc test.

