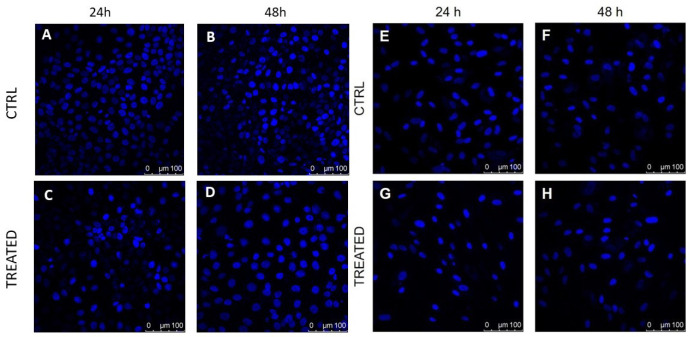
Figure 3.
DAPI staining performed on cultured human fibroblasts (right) and HaCaT cells (left) shows differences in treated and control samples: (A,B) control HaCaT samples analyzed 24 and 48 h after the beginning of the experiment; (C,D) treated HaCaT cells analyzed at 24 and 48 h after the application of blue light with 41.2 J/cm fluence; (E,F) control fibroblasts samples analyzed 24 and 48 h after the beginning of the experiment; and (G,H) treated fibroblasts cells analyzed at 24 and 48 h after treatment with a blue light dose of 41.2 J/cm, respectively. Cells nuclei are in blue.

