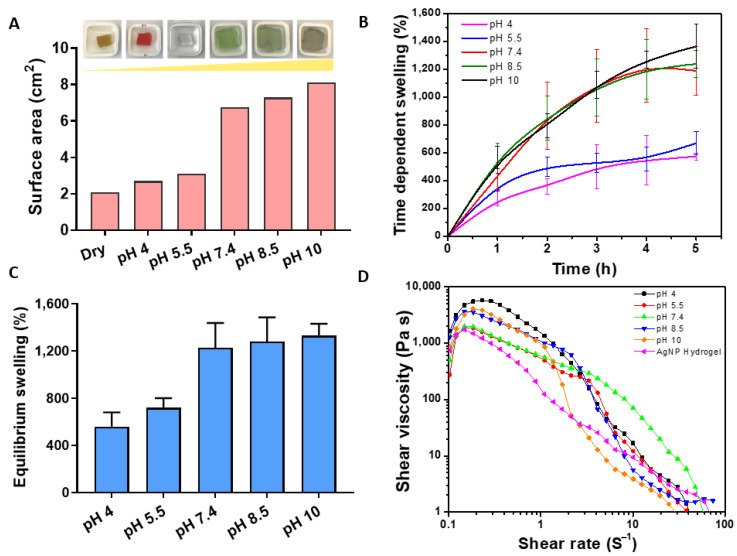
Figure 2.
(A) Change in surface area (cm2) of the hydrogel in response to different pH (4–10) with the corresponding hydrogel photo after equilibrium swelling. The colors are due to the commercial pH buffer used. (B) Time dependence swelling kinetics after 5 h of swelling. (C) The difference in hydrogel swelling rate after reaching an equilibrium state. (D) Measurements of hydrogel mechanical properties measured by shear rate after equilibrium state.

